Viewing Backup Overview
Download
Focus Mode
Font Size
TDSQL-C for MySQL provides a backup overview page, enabling you to quickly understand backup space usage and trends. This document describes how to view the backup overview of a cluster through the console.
Scenarios
The backup overview page is designed for centralized viewing of backup space usage, storage amounts of various backup files, and backup usage trends over time for TDSQL-C for MySQL clusters. This helps you understand backup resource consumption and plan your backup policy effectively. You can refer to this document for term explanations and viewing instructions related to the backup overview page.
Operation Steps
Backup Overview Under the Backup Management Page
1. Log in to the TDSQL-C for MySQL console.
2. In the region selector above, locate the target cluster. Click the cluster ID or Manage in the Operation column to go to the cluster management page.
3. On the cluster management page, choose Backup Management > Backup Overview.
4. View Backup Usage. You can view the backup space usage of the current cluster in the backup usage section. Details are as follows.

Parameter | Description |
Data Backup | Displays details of the total data backups generated by the current cluster. Data backups include manual/automatic snapshot backups and manual/automatic logical backups in the local region. Snapshot backup: You can view the snapshot backup usage of the current cluster here, including total usage, automatic backup usage, and manual backup usage. Logical backup: You can view the logical backup usage of the current cluster here, including total usage, automatic backup usage, and manual backup usage. Free quota: You can view the billable usage, free usage, and free quota for data backup of the current cluster here. 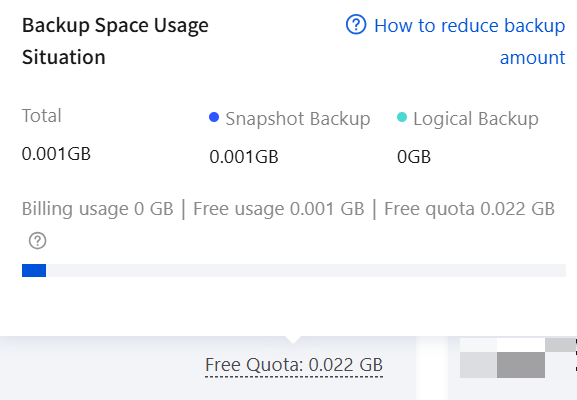 |
Log Backup | Displays details of the total log backups generated by the current cluster. Log backups include redolog backups and Binlog backups in the local region. Redolog backup: You can view the Redolog backup usage of the current cluster here. Binlog backup: You can view the Binlog backup usage of the current cluster here. Free quota: You can view the billable usage, free usage, and free quota for log backup of the current cluster here. 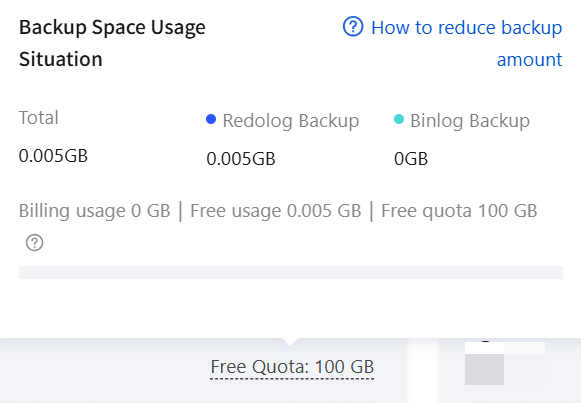 |
Cross-Region Backup | Displays details of the cross-region backup for the current cluster. Cross-region backup includes logical backups, snapshot backups, and redolog backups in regions other than where the cluster resides. You can also query the number of cross-region regions here. Note: If cross-region backup usage is displayed as 0 here, cross-region backup is not enabled for the current cluster. To enable cross-region backup, see Cross-Region Backup. Cross-region data backup + cross-region redo log backup have no free quota. Backups generated by these services are billable. |
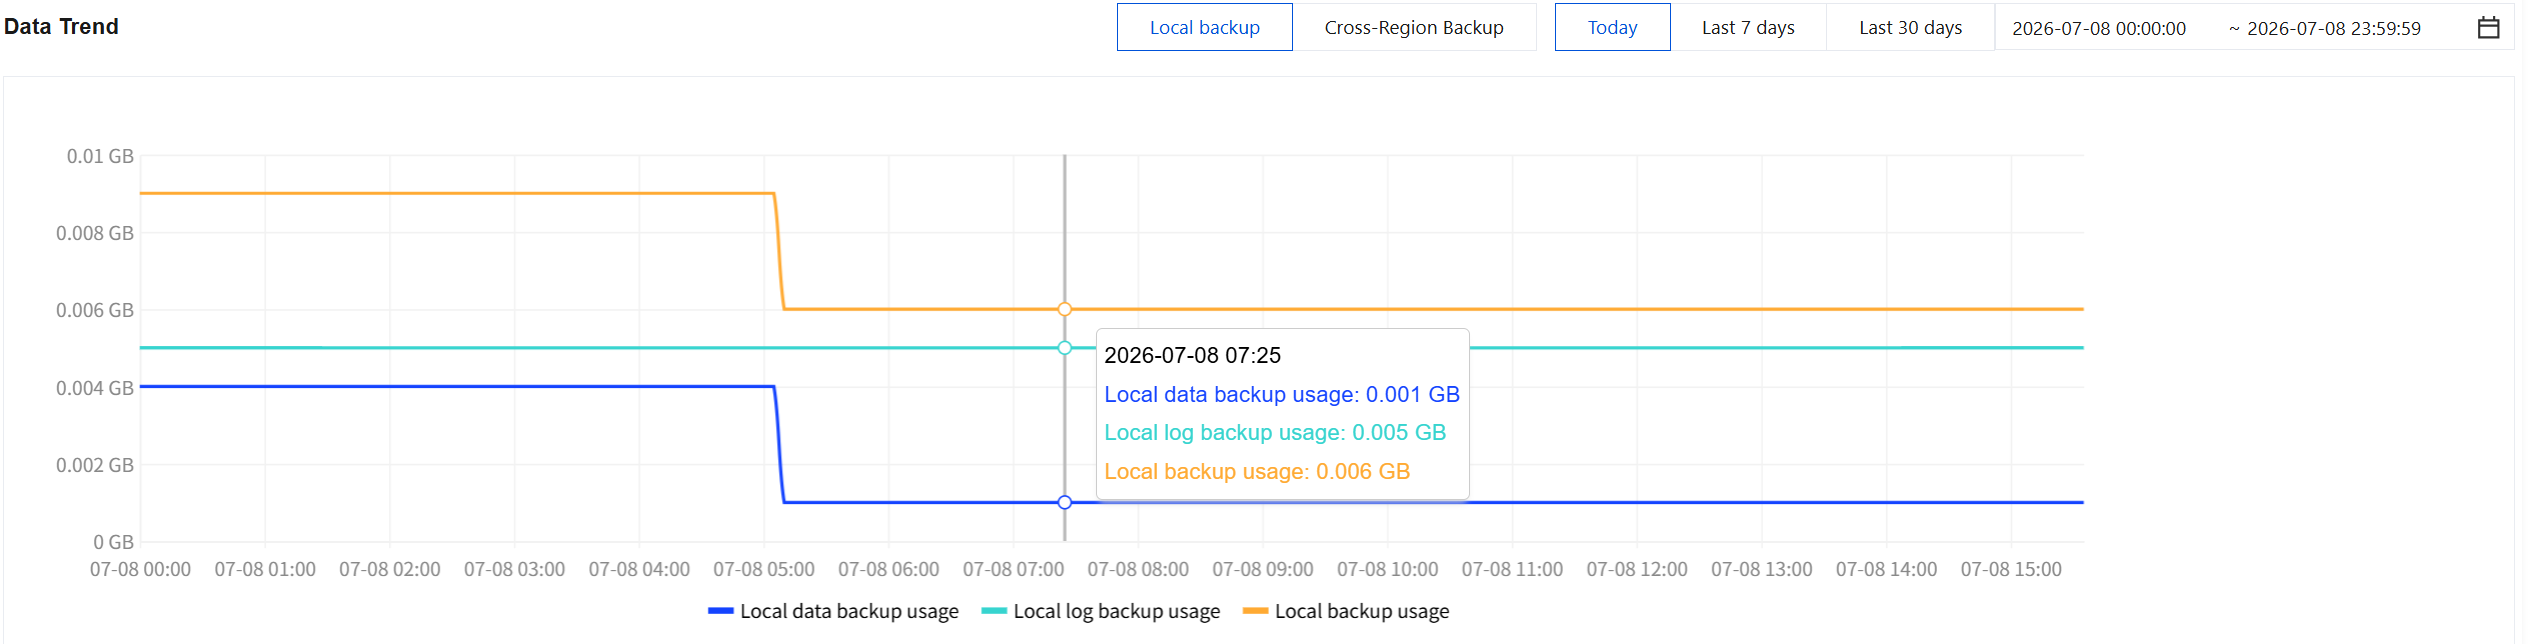
5. View Data Trend. You can view the trend charts for local backup or cross-region backup of the current cluster in the data trends section. Details are as follows.
Level | Description |
Backup scope | You can switch between viewing the local backup or cross-region backup trend charts. |
Time Range | You can select a time range to view the trend chart, including: Today, Last 7 days, Last 30 days, and a custom period. |
Metric | The trend chart displays the local or cross-region backup usage for you, including: data backup usage, log backup usage, and total backup usage. When you hover the mouse over any time point on the trend chart, it shows the backup usage for the selected time point. |
Backup Overview Under the Cluster Details Page
1. Log in to the TDSQL-C for MySQL console.
2. In the region selector above, locate the target cluster. Click the cluster ID or Manage in the Operation column to go to the cluster management page.
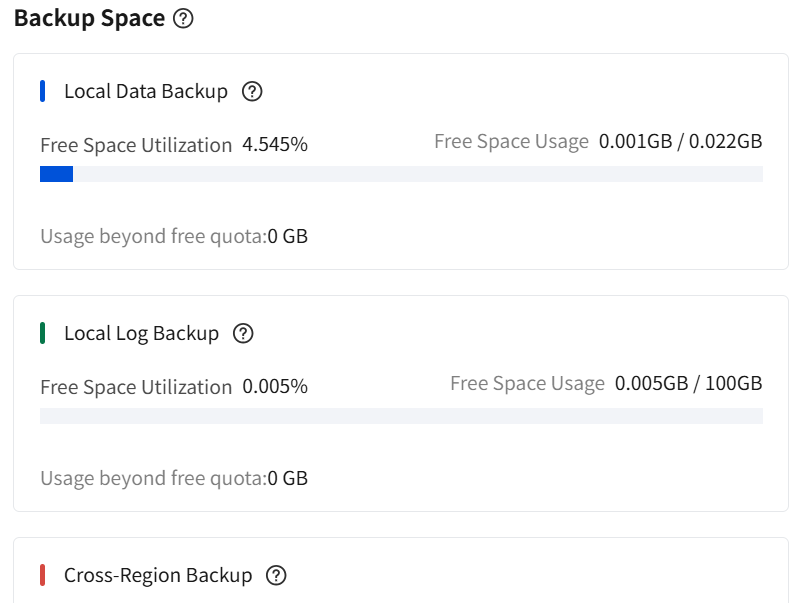
3. You can also view the backup space usage of the current cluster under Cluster Details > Instance Info > Backup Space.
Billing Overview
For the specific billing rules after the backup feature is commercialized, see Backup Space Billing Description.
Help and Support
Was this page helpful?
You can also Contact sales or Submit a Ticket for help.
Help us improve! Rate your documentation experience in 5 mins.
Feedback