Distributed Tracing
Download
Focus Mode
Font Size
With the widespread adoption of microservices architecture, a single business logic call request may involve several, dozens, or even hundreds of backend service APIs, forming a complex distributed network of backend services. In this scenario, how to quickly locate the root cause when a request exception occurs becomes a critical issue for troubleshooting in distributed environments.
Cloud Native Intelligent Gateway supports the distributed tracing feature. Users can query specific call processes based on criteria such as specific services, status codes, and response times, including the time required and the operational status of those processes. Based on this information, users can analyze the time consumption and exceptions at each stage of the distributed call chain, for example:
Time-consuming services
Unreasonable call logic (For example, if a service is called multiple times in one request, it is recommended that APIs be called in batches.)
Enabling Linkage Tracking
1. Log in to the TSF console.
2. In the left sidebar, click Cloud Native Gateway and select the gateway instance for which you want to enable linkage tracking.
3. Click the instance ID/Name to go to the instance details page.
4. Click the Data Observation tab.
5. Click the Linkage Tracking tab, and then click Enable Now in the middle of the page to enable linkage tracking.
Protocols: OpenTelemetry (recommended), SkyWalking, Zipkin, and Jaeger are supported. By default, the gateway uses the linkage tracking protocol specified by the client in the request. If the client does not specify a protocol, the protocol specified in the console is used.
APM Business System: After you select it, the gateway will use this APM business system for linkage reporting.
Sampling Rate: The value range is 0 to 100. 0 indicates that collection is not performed, and 100 indicates that all requests are collected. The default value is 10. A high sampling rate may affect performance.
Note:
To display the complete call linkage, ensure that the downstream services of the gateway use the same APM business system for reporting. For the application reporting method, see Application Reporting Guide.
Linkage tracking is provided by Application Performance Management. For specific billing items, see Billing Overview.
Querying Call Chain Details
After linkage tracking is enabled, you can view the call chain and details of the gateway instance on the linkage tracking page.
1. On the Call Chain Query page, set the query conditions and click Query.
Time Range: Specific and custom time ranges are supported. Specific time ranges include last 5 minutes, last 15 minutes, last 30 minutes, last 1 hour, last 3 hours, last 12 hours, and last 1 day.
Response Time: Set the response time range.
Trace ID (optional): trace ID.
Service: Select the service to be queried from the dropdown list, or enter keywords to search.
Status Code (optional): status code.
Health Status (optional):
Normal: The call is normal assessed based on the response time and error rate.
Slow Call: The execution time of the call exceeds 2000 ms.
Abnormal: A non-200 HTTP status code is returned for the call.
Business Tag: tag used by the gateway for linkage tracking.
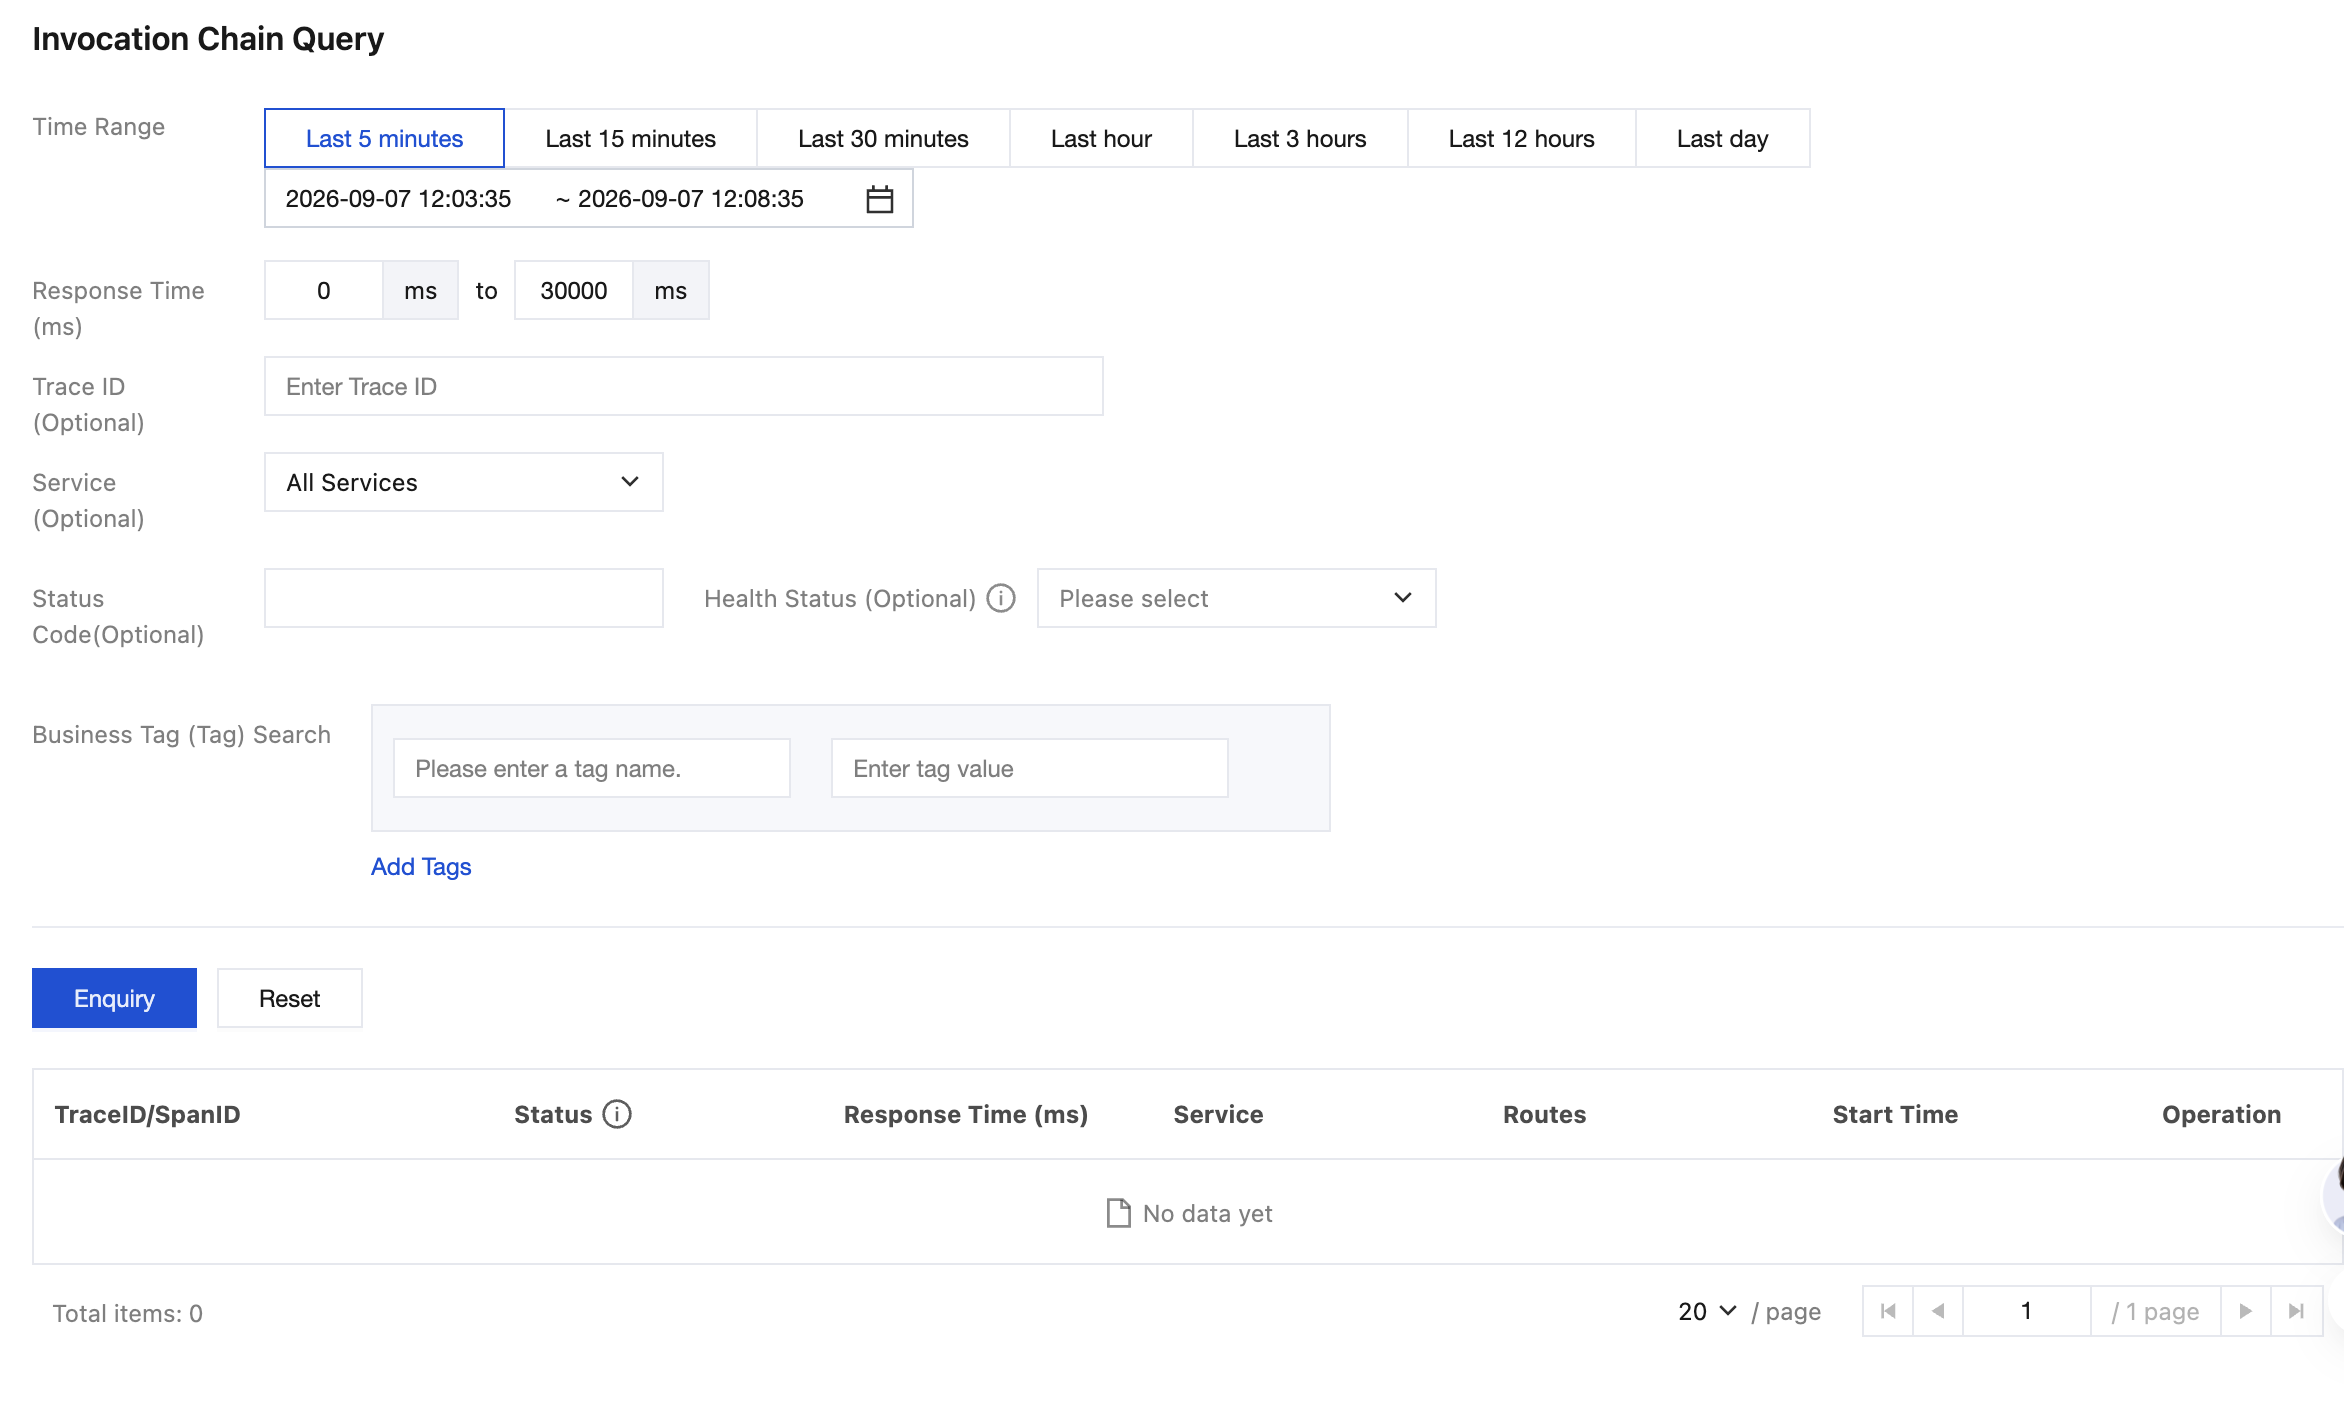
2. Click the "ID" of the call chain or View Details in the operation column to view the detailed information of the call chain, which includes the call information details and the time consumption of each stage.

Viewing the Service Dependency Topology Diagram
After linkage tracking is enabled, you can view the service dependency topology diagram on the Basic Information page of the service. Based on the service dependency topology diagram, you can intuitively understand the upstream and downstream components of the service and their calling relationships, thereby finding the application bottleneck faster.
1. In the left sidebar, click Cloud Native Gateway, select the gateway instance you want to view, and click its ID/Name to go to the instance details page.
2. Click the Service & Route > Service tab.
3. Click the service name you want to view to go to the service details page, switch to the Service Information tab, and then you can view the service call information in the dependency topology module after setting the time range.
Help and Support
Was this page helpful?
You can also Contact sales or Submit a Ticket for help.
Help us improve! Rate your documentation experience in 5 mins.
Feedback