Dev Efficiency Dashboard
Download
Focus Mode
Font Size
The enterprise management console supports measuring and analyzing usage of users within the enterprise, helping enterprise managers observe efficiency improvement results and optimize efficiency improvement plans. R&D efficiency measurement provides the following capabilities:
R&D Efficiency Dashboard: aggregates and analyzes enterprise usage, suitable for measuring the overall R&D efficiency of the enterprise.
Member Data: view the data of each enterprise member, suitable for detailed evaluation and specific analysis.
Dev Efficiency Dashboard
Go to Enterprise Management Console and choose Data Statistics > R&D Efficiency Dashboard. You can see that the R&D Efficiency Dashboard has been fully upgraded to support viewing updated metric data, while historical data requires switching to the old dashboard. The dashboard supports switching between Metric View and Trend View. Each view includes four types of metric parameters: Active Status, Conversation Metrics, and Completion Metrics and Code Generation Metrics. In addition, Completion Metrics support display and analysis by language. The overall panel is clear, and each metric includes a detailed description of its calculation method.
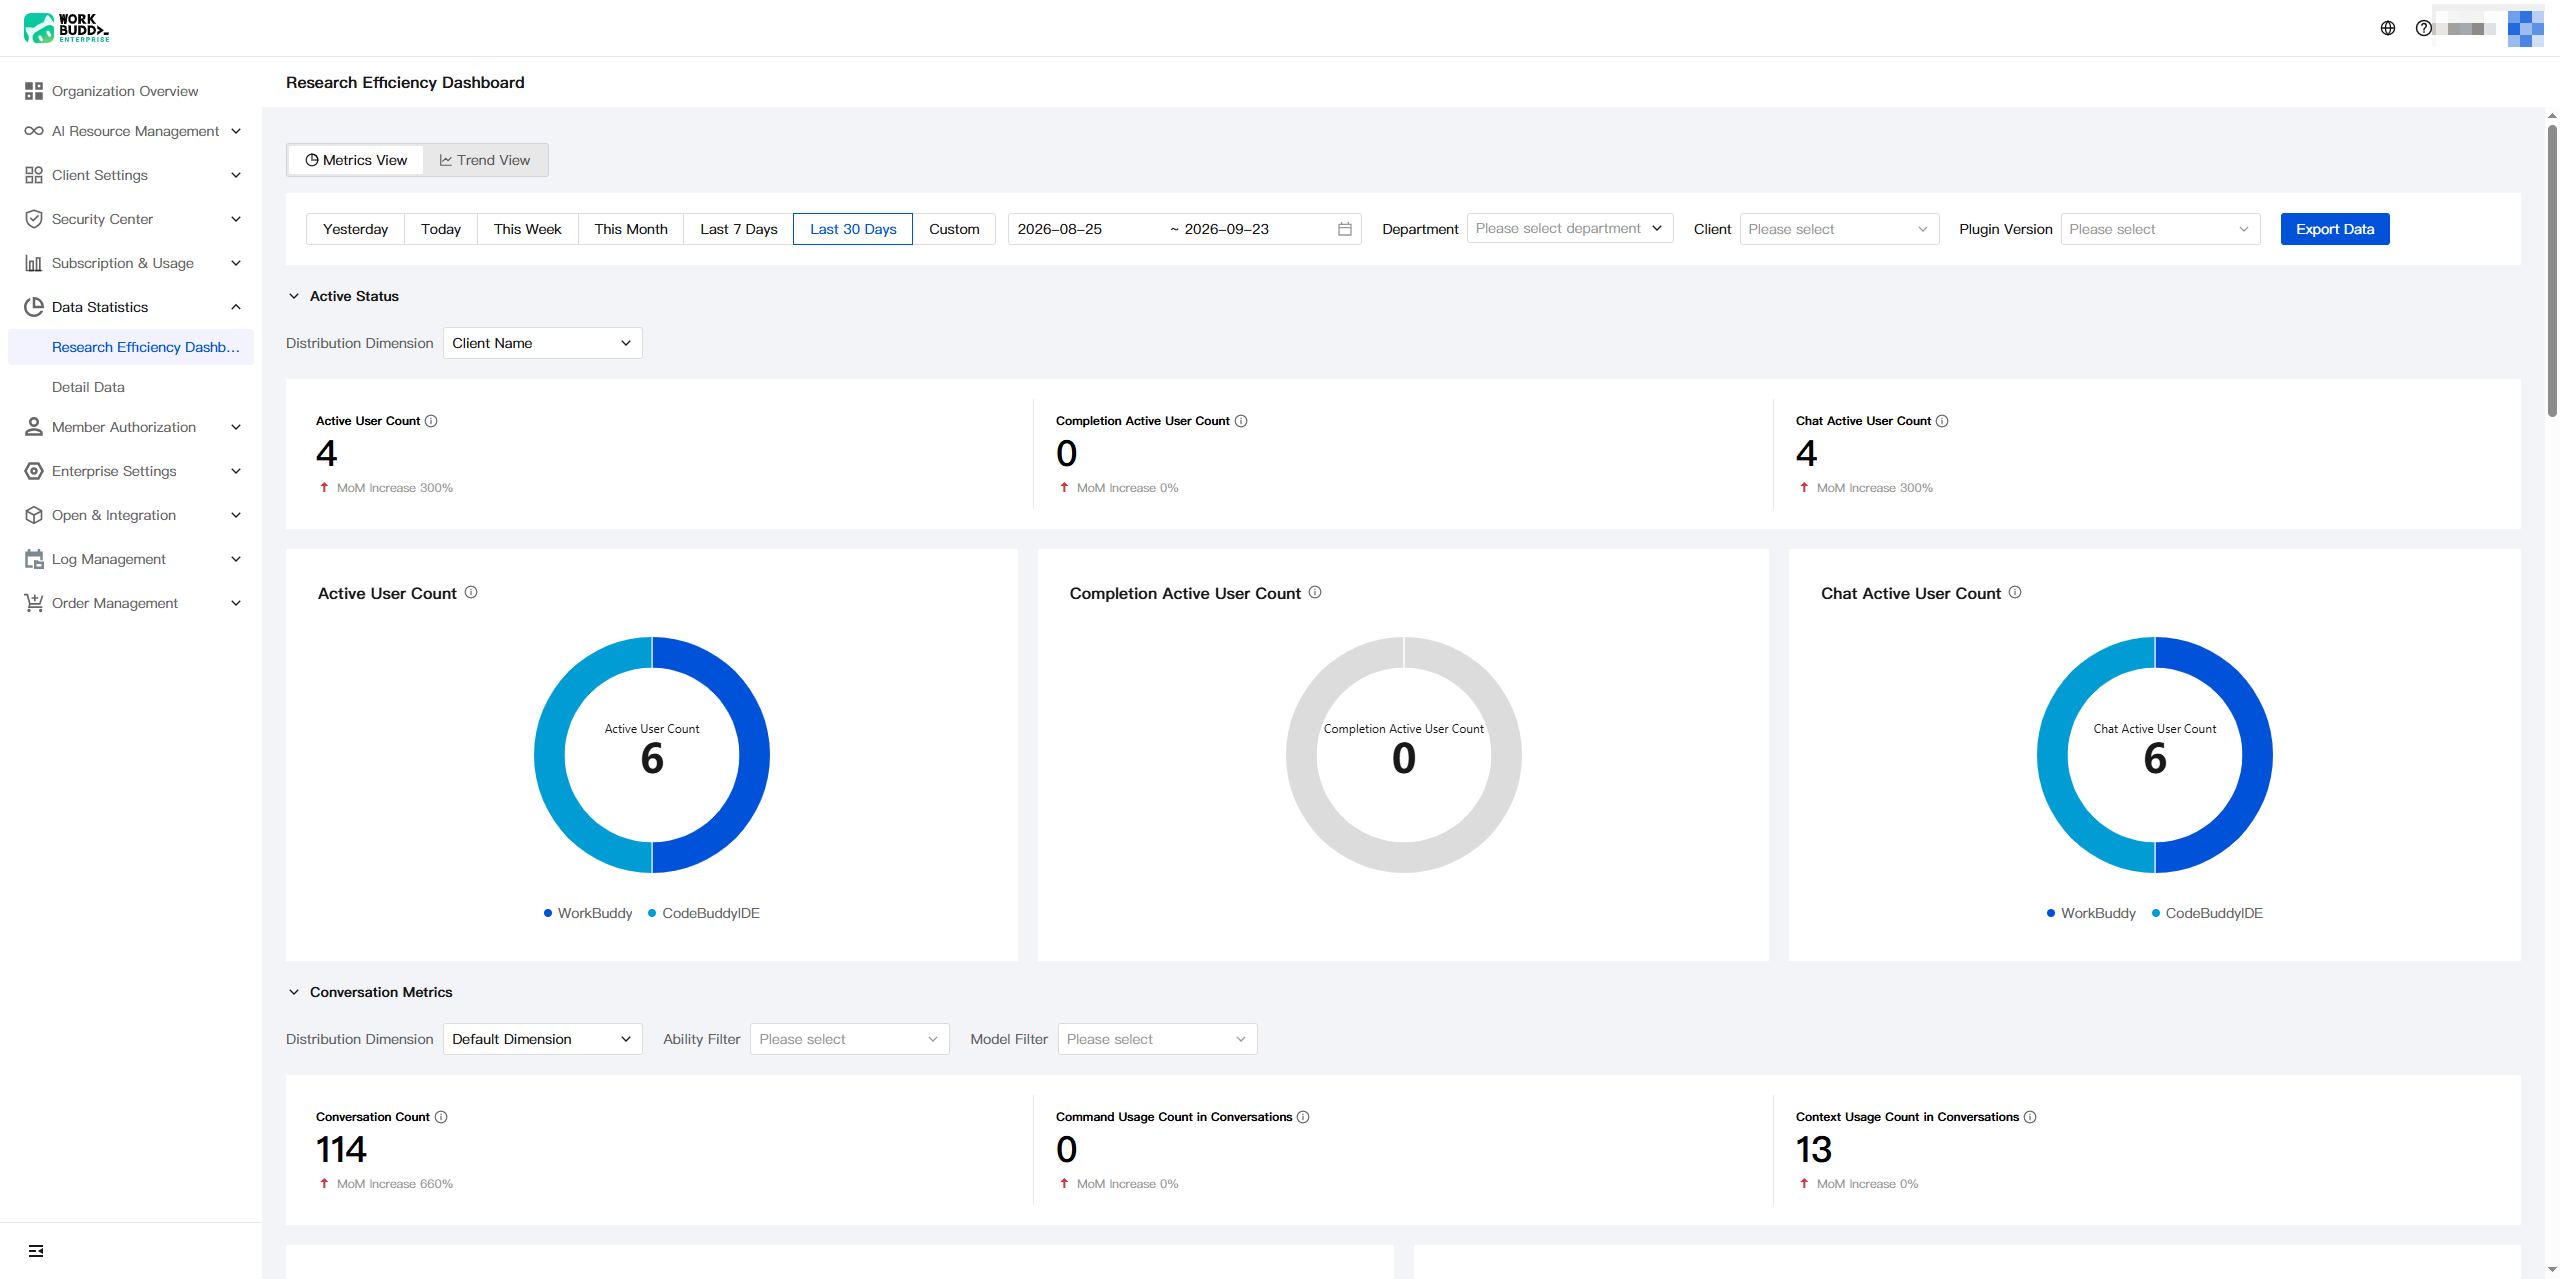
Metric View
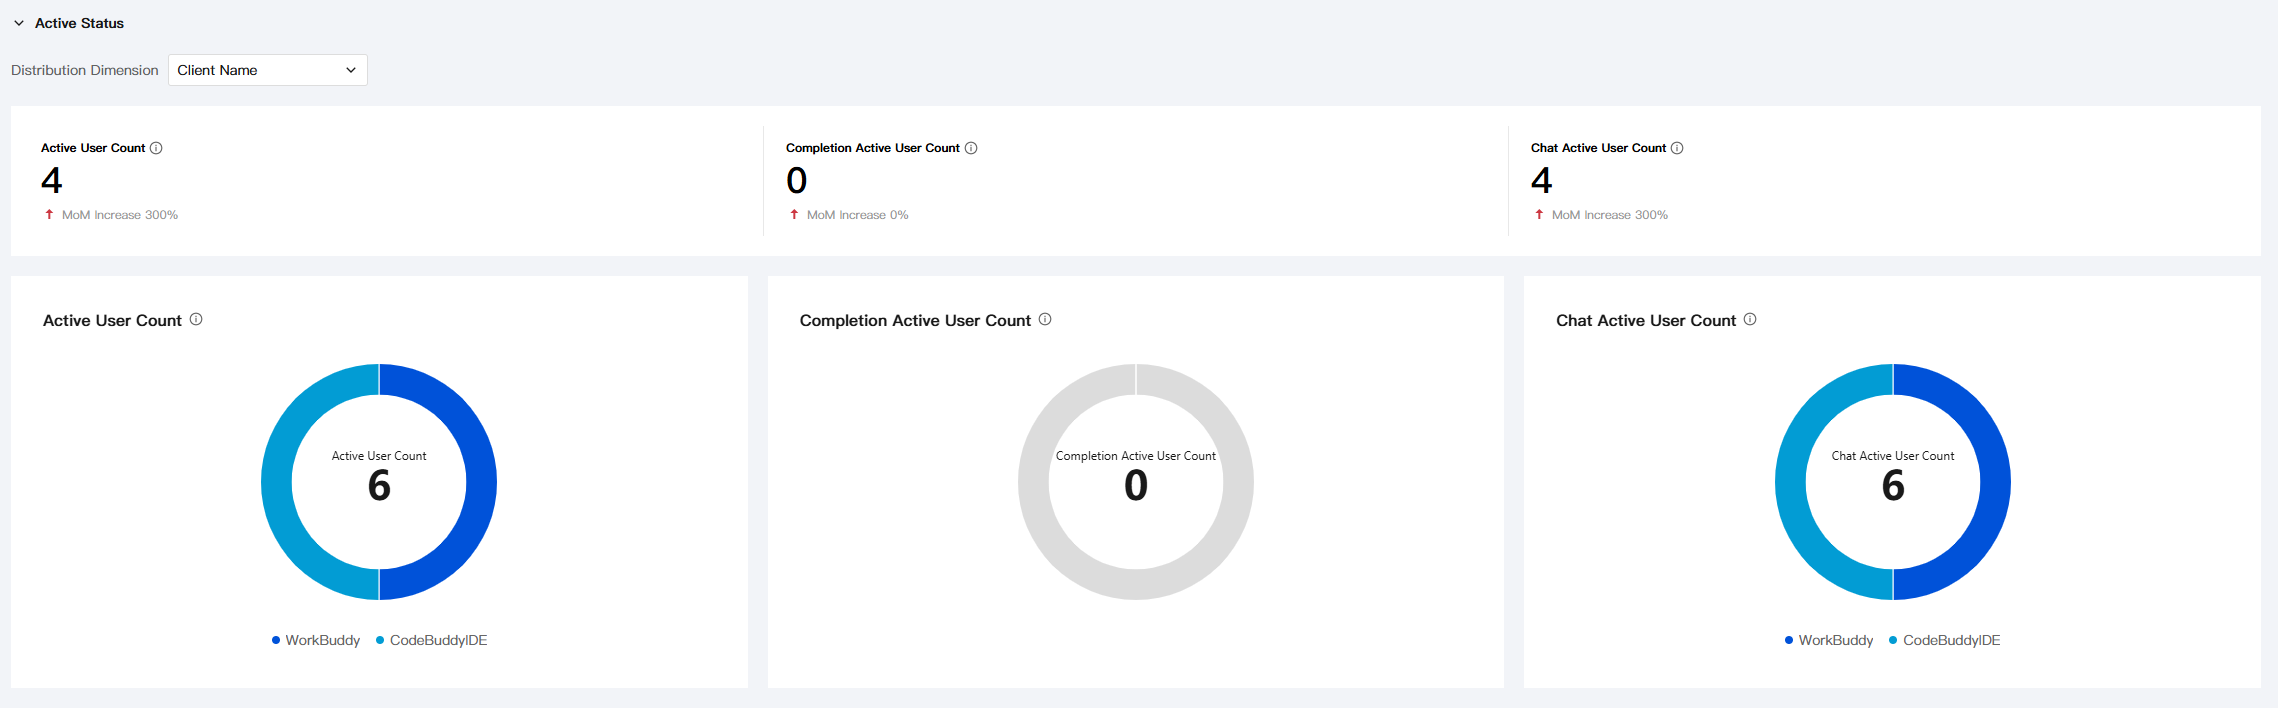
Active Status
The Active Status category includes three metrics: Active User Count, Completion Active User Count, and Chat Active User Count. Each metric is displayed in both text and chart formats, and you can clearly see the proportion of active users for each IDE.
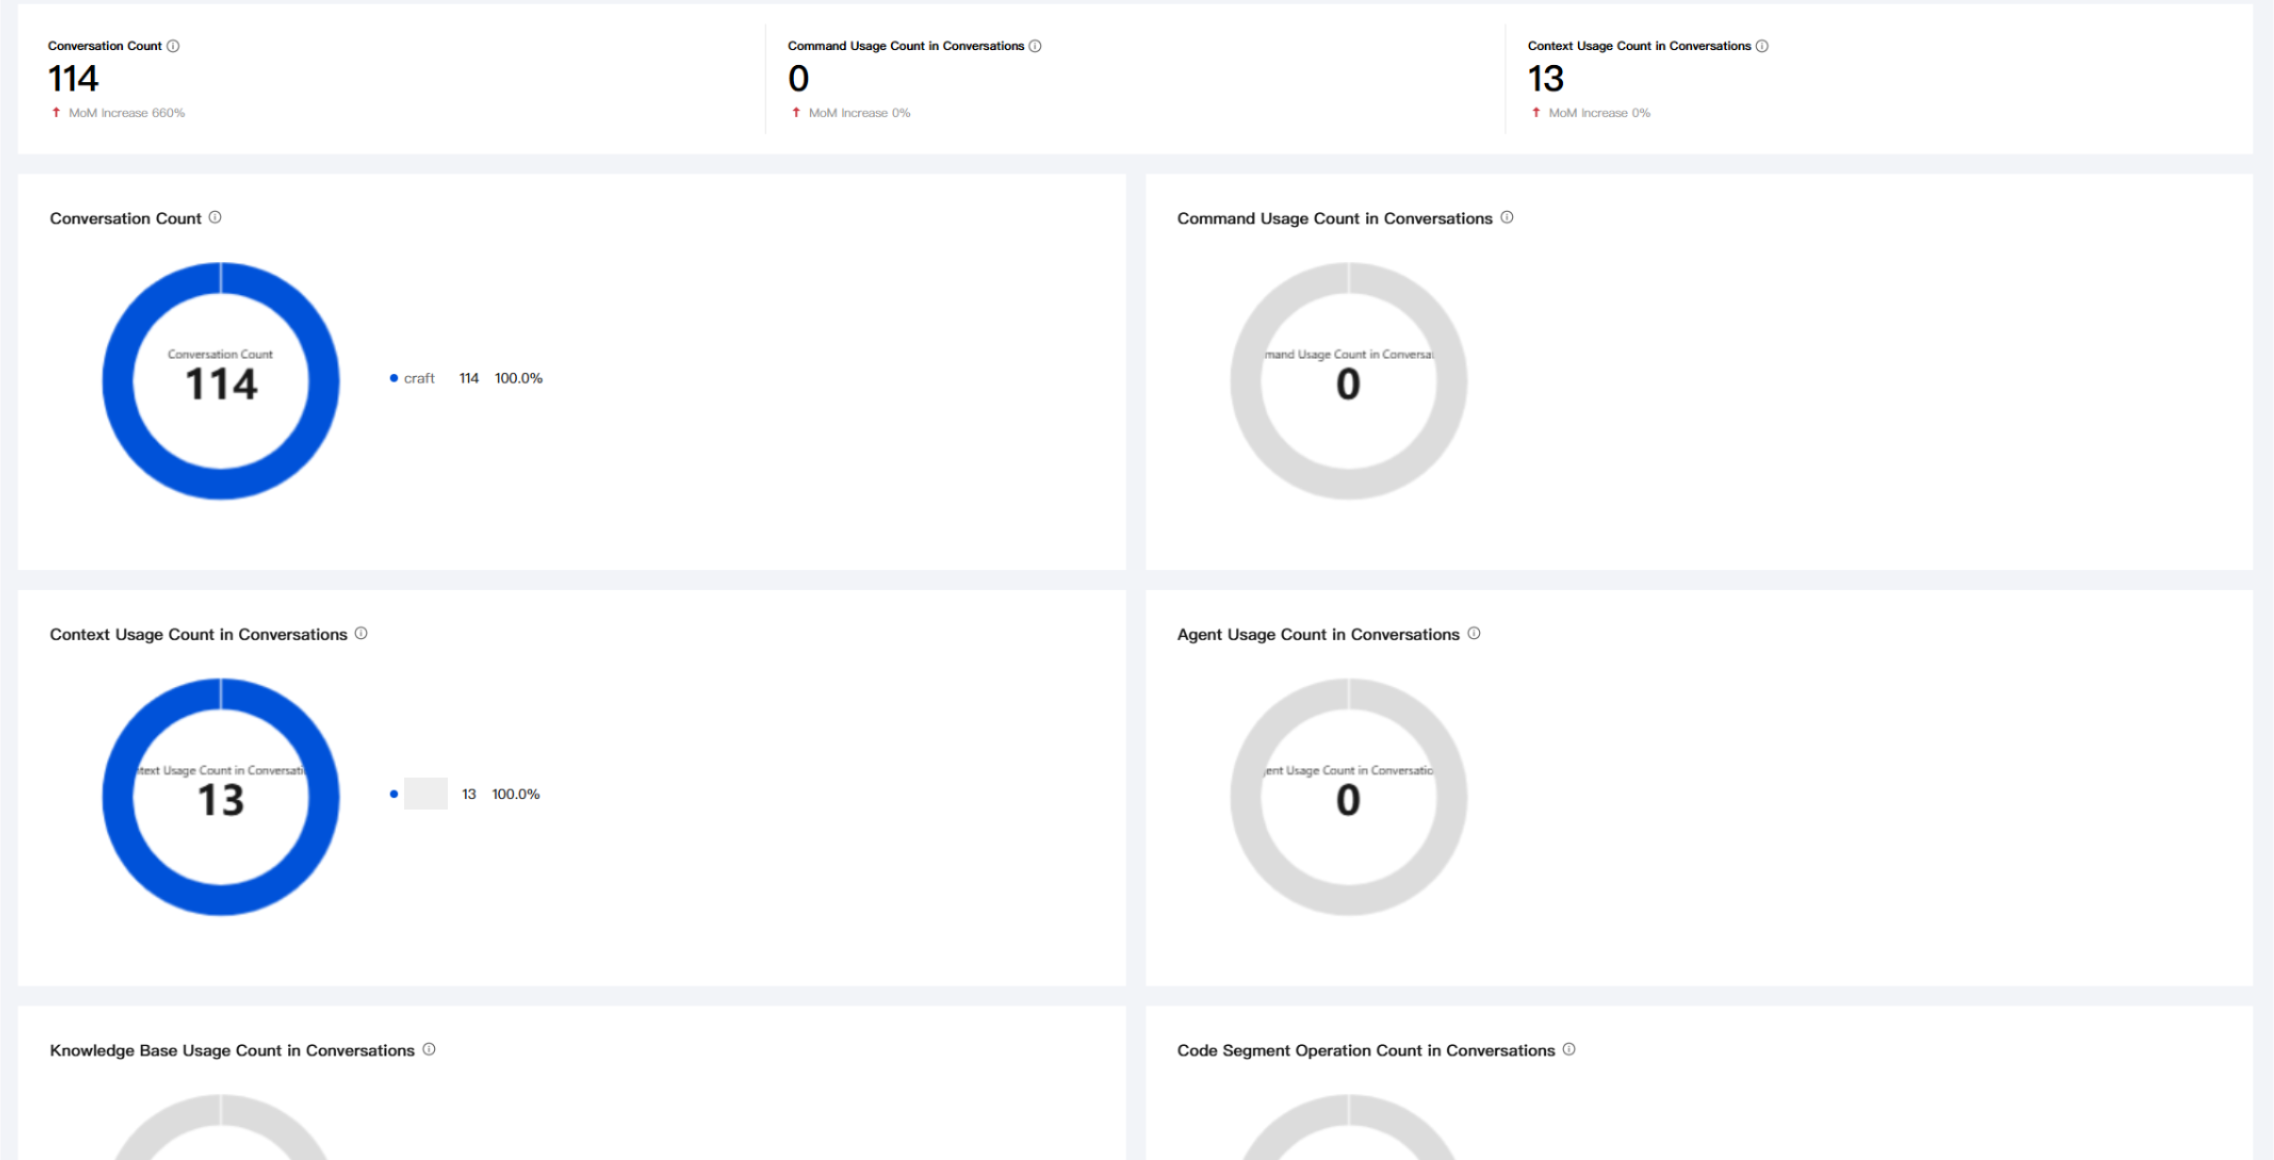
Conversation Metrics
The Conversation Metrics category includes six metrics: Conversation Count, Command Usage Count in Conversations, Context Usage Count in Conversations, Agent Usage Count in Conversations, Knowledge Base Usage Count in Conversations, and Code Segment Operation Count in Conversations. Each metric is displayed in both text and chart formats.
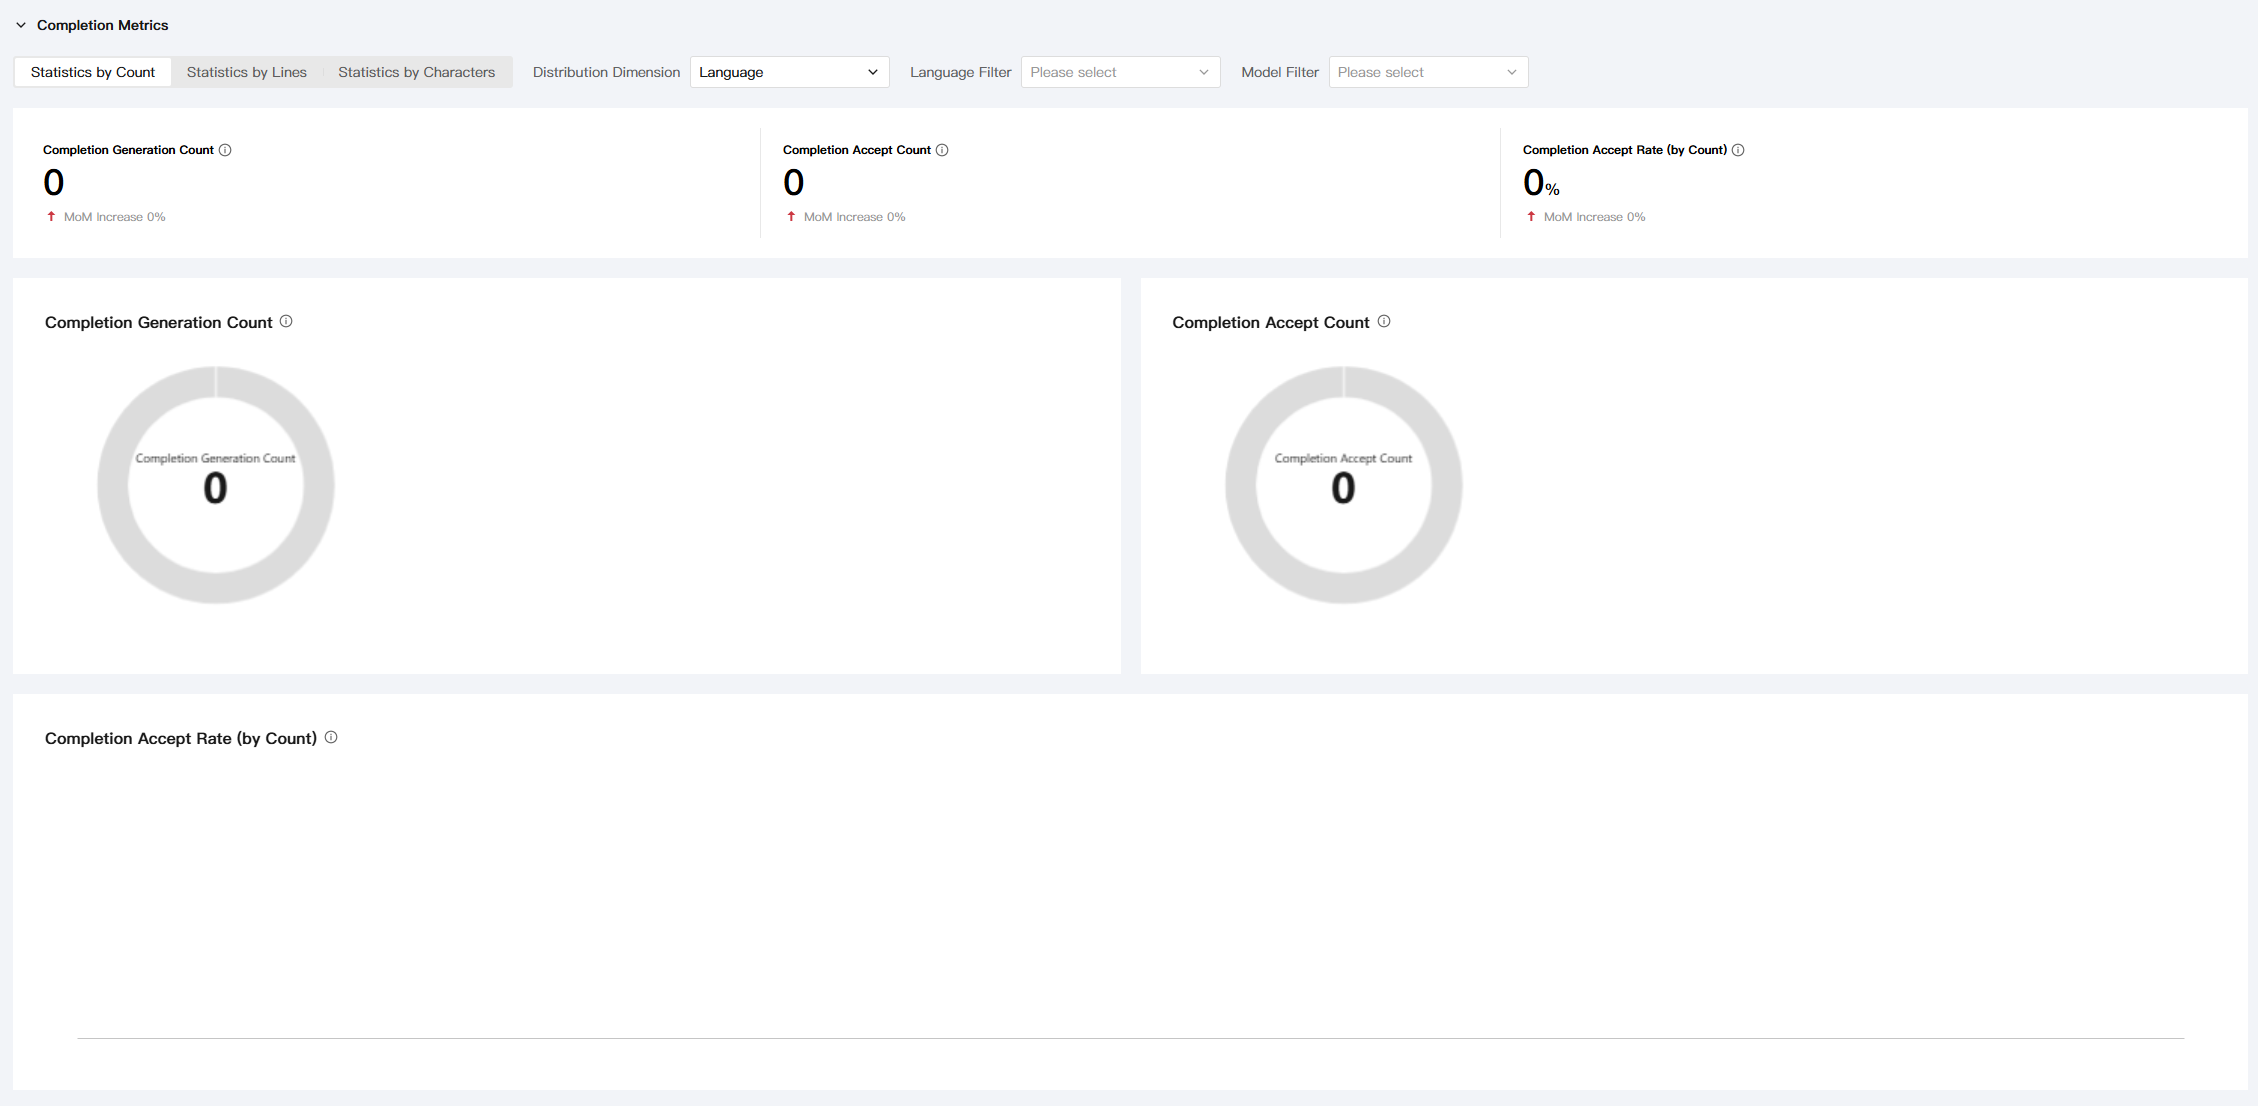
Completion Metrics
The Completion Metrics category includes three statistical methods with different dimensions: Statistics by Count, Statistics by Lines, and Statistics by Characters. Each method contains corresponding metrics, and each metric can be displayed by language to help you perform in-depth analysis.
Code Generation Metrics
The Code Generation Metrics category is divided into two statistical methods with different dimensions: Statistics by Lines and Statistics by Characters. Each method contains corresponding metrics, and each metric can be displayed by language, Generation Source, client name, client version, or plugin version to help you perform in-depth analysis.
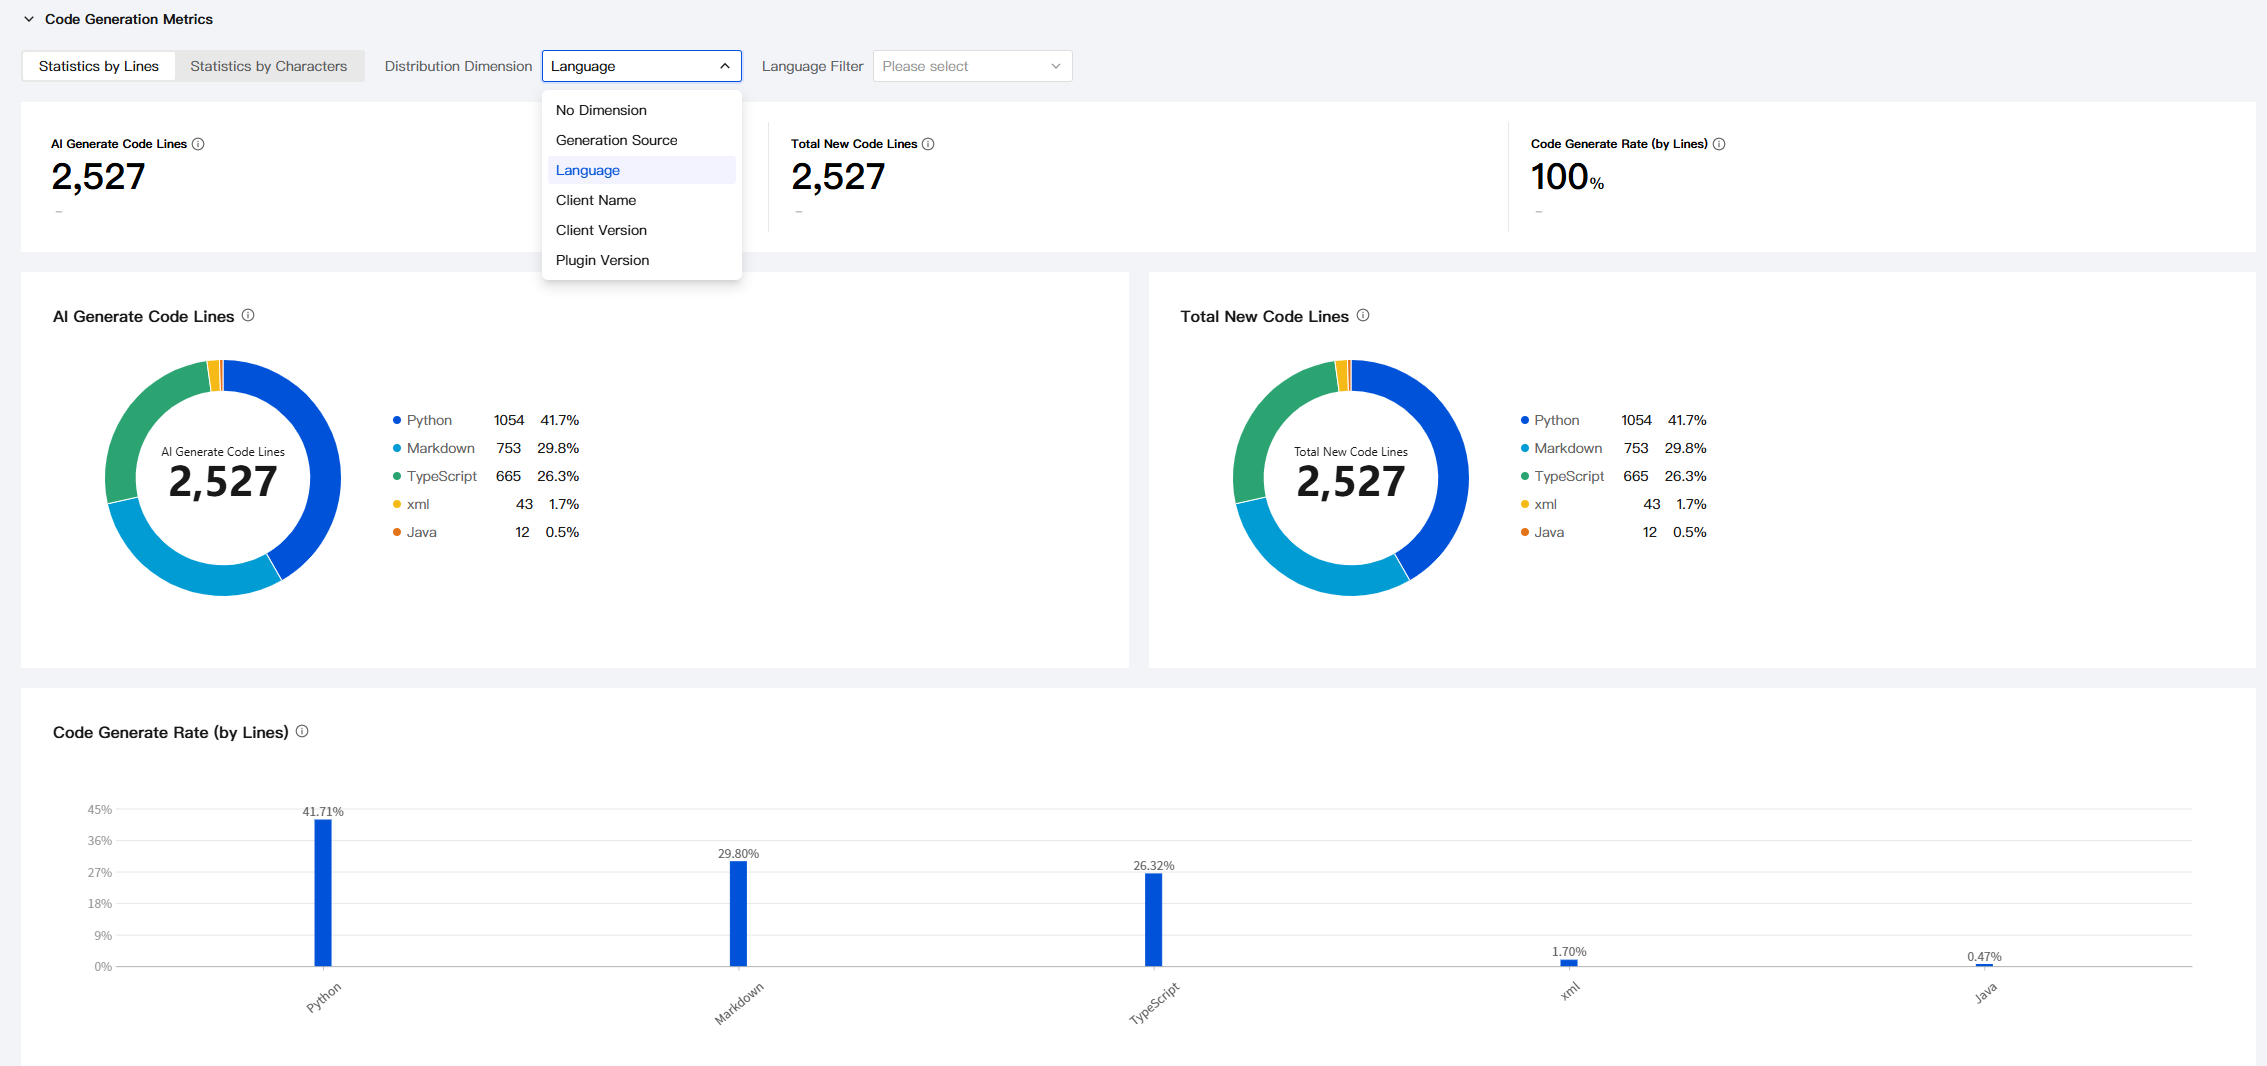
As an enterprise manager, the most important concept is "how much code Code Assistant has helped the enterprise generate." Code Assistant quantifies this concept as Code Generation Rate. The following describes the calculation logic of this metric.
Depending on the calculation method, the code generation rate can be calculated by line or by character:
Calculate by line
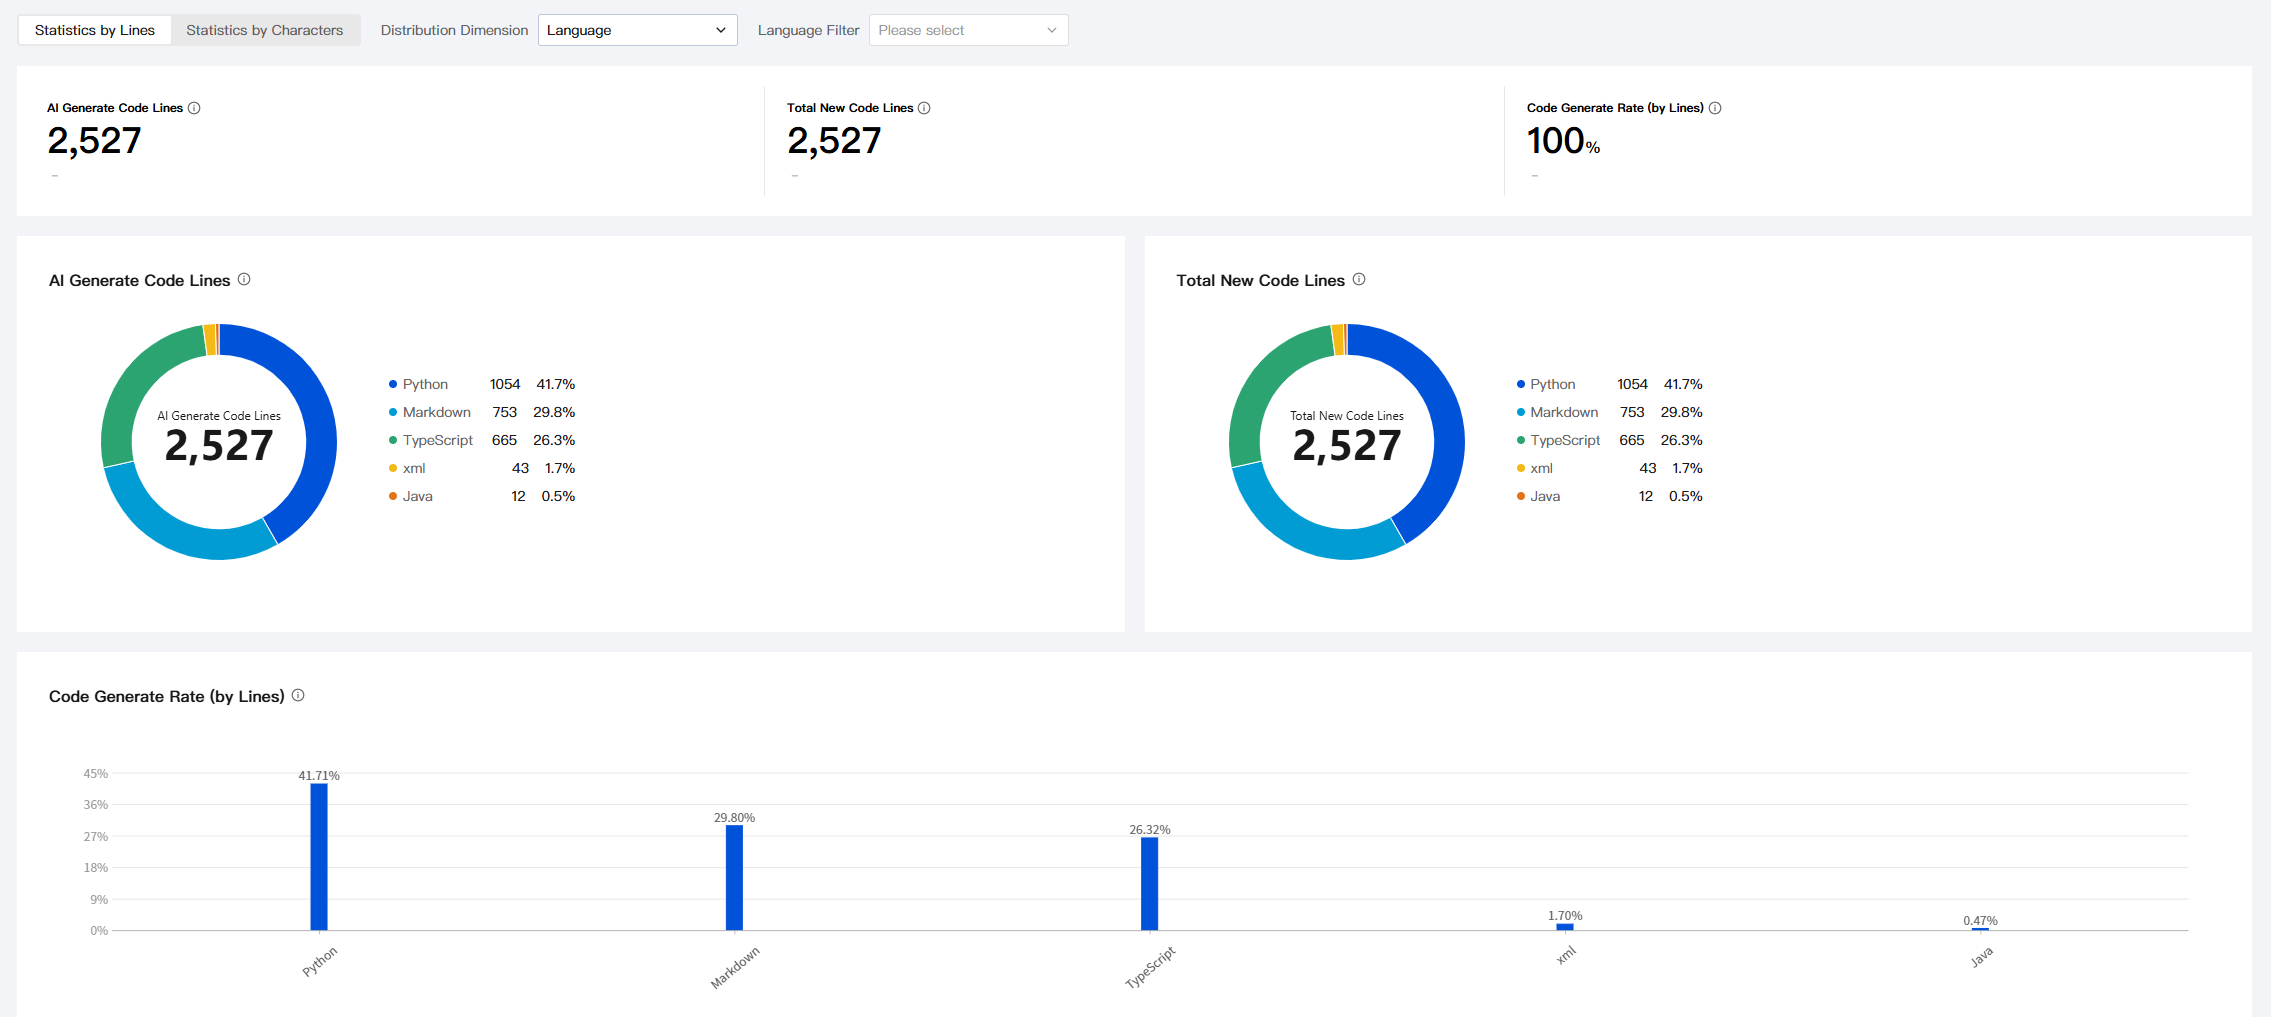
Code Generation Rate (by line) = (AI-generated lines of code / Total newly added lines of code) × 100%. For example, if the Code Generation Rate (by line) = 20%, it means that during the statistical period, 20 out of every 100 lines of code were generated by Code Assistant.
Calculate by character
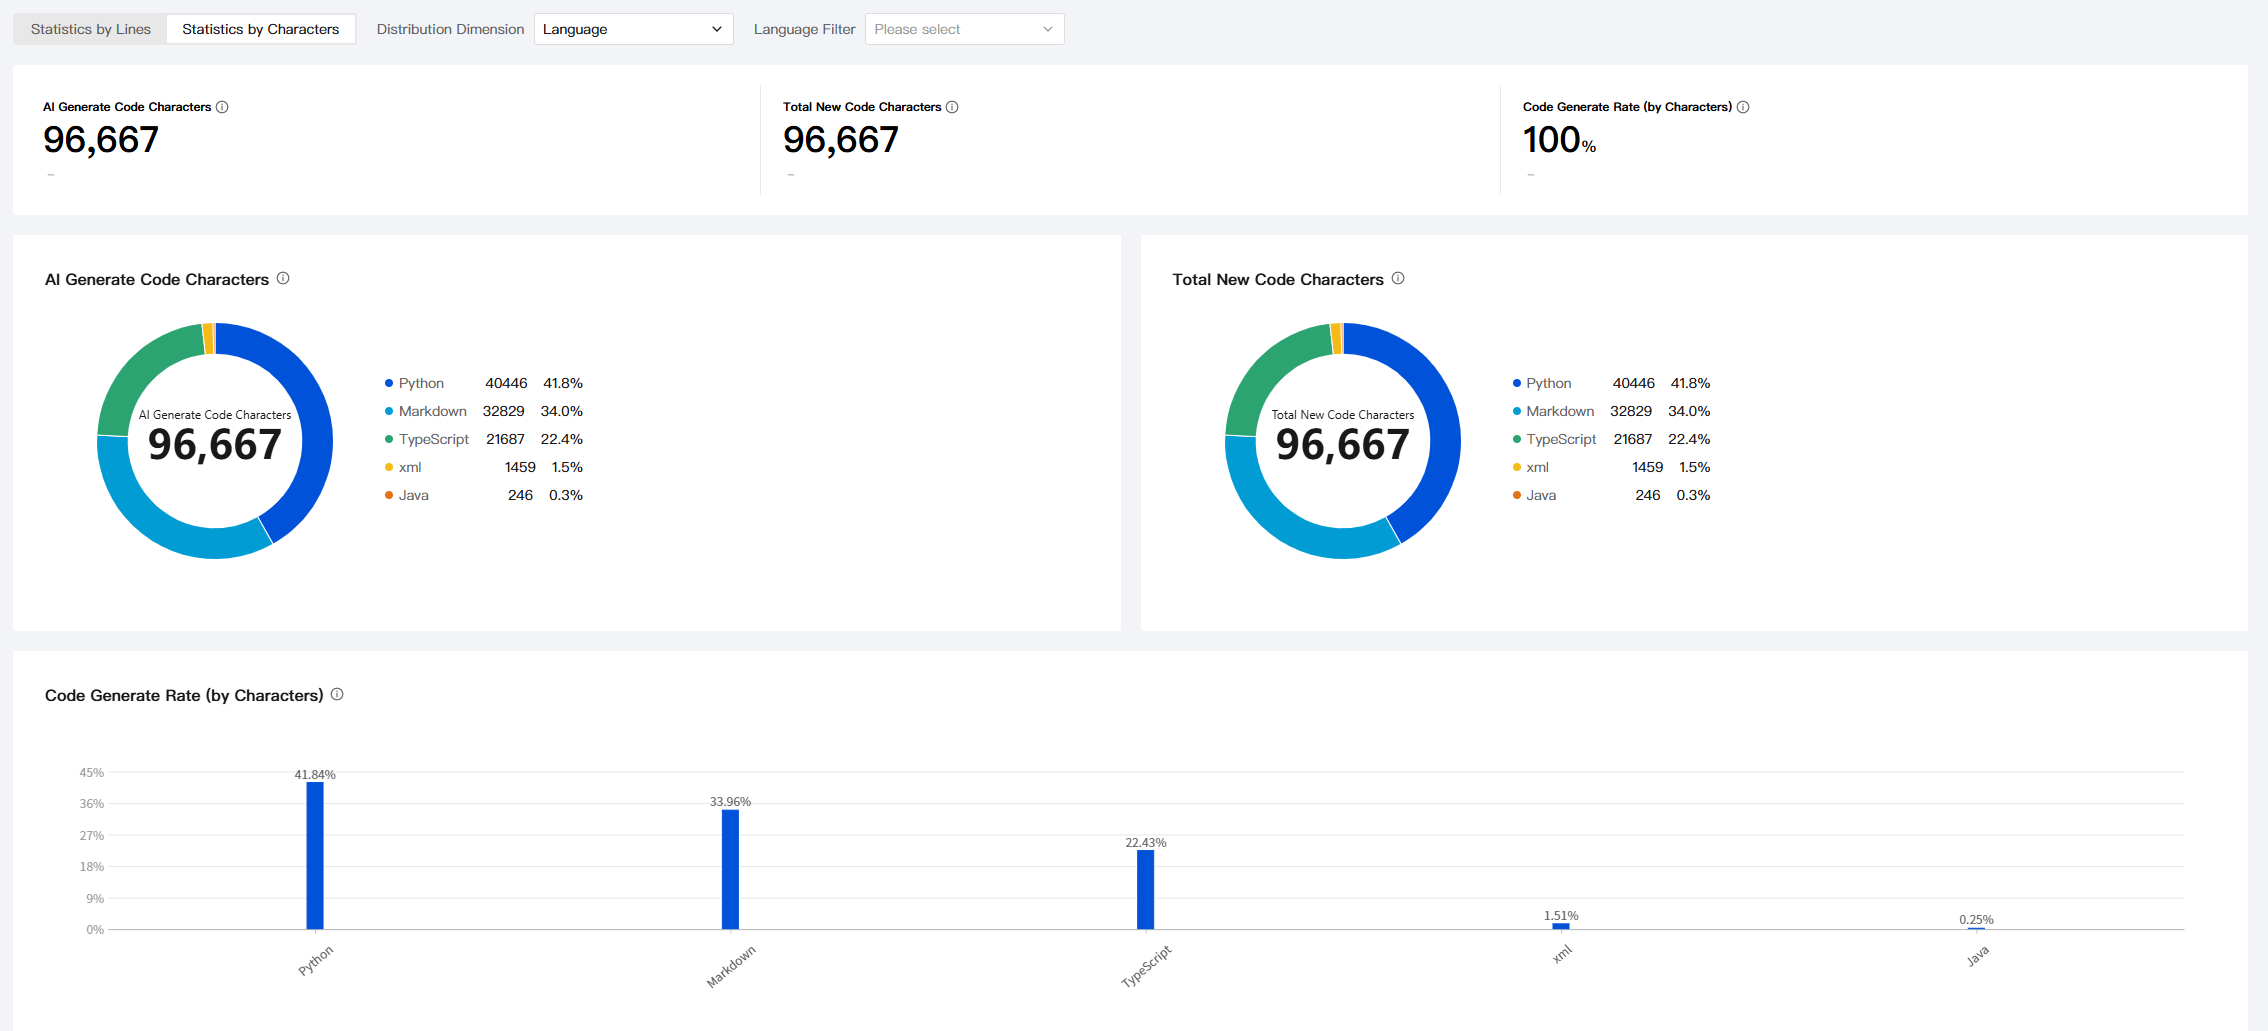
Code Generation Rate (by character) = (AI-generated code characters / Total newly added code characters) × 100%. For example, if the Code Generation Rate (by character) = 20%, it means that during the statistical period, 20 out of every 100 generated characters were generated by Code Assistant.
The Code Generation Rate helps enterprises quantify the impact of Code Assistant on R&D efficiency, which in turn enables them to measure the return on investment in this area, making it quantifiable and observable.
Trend View
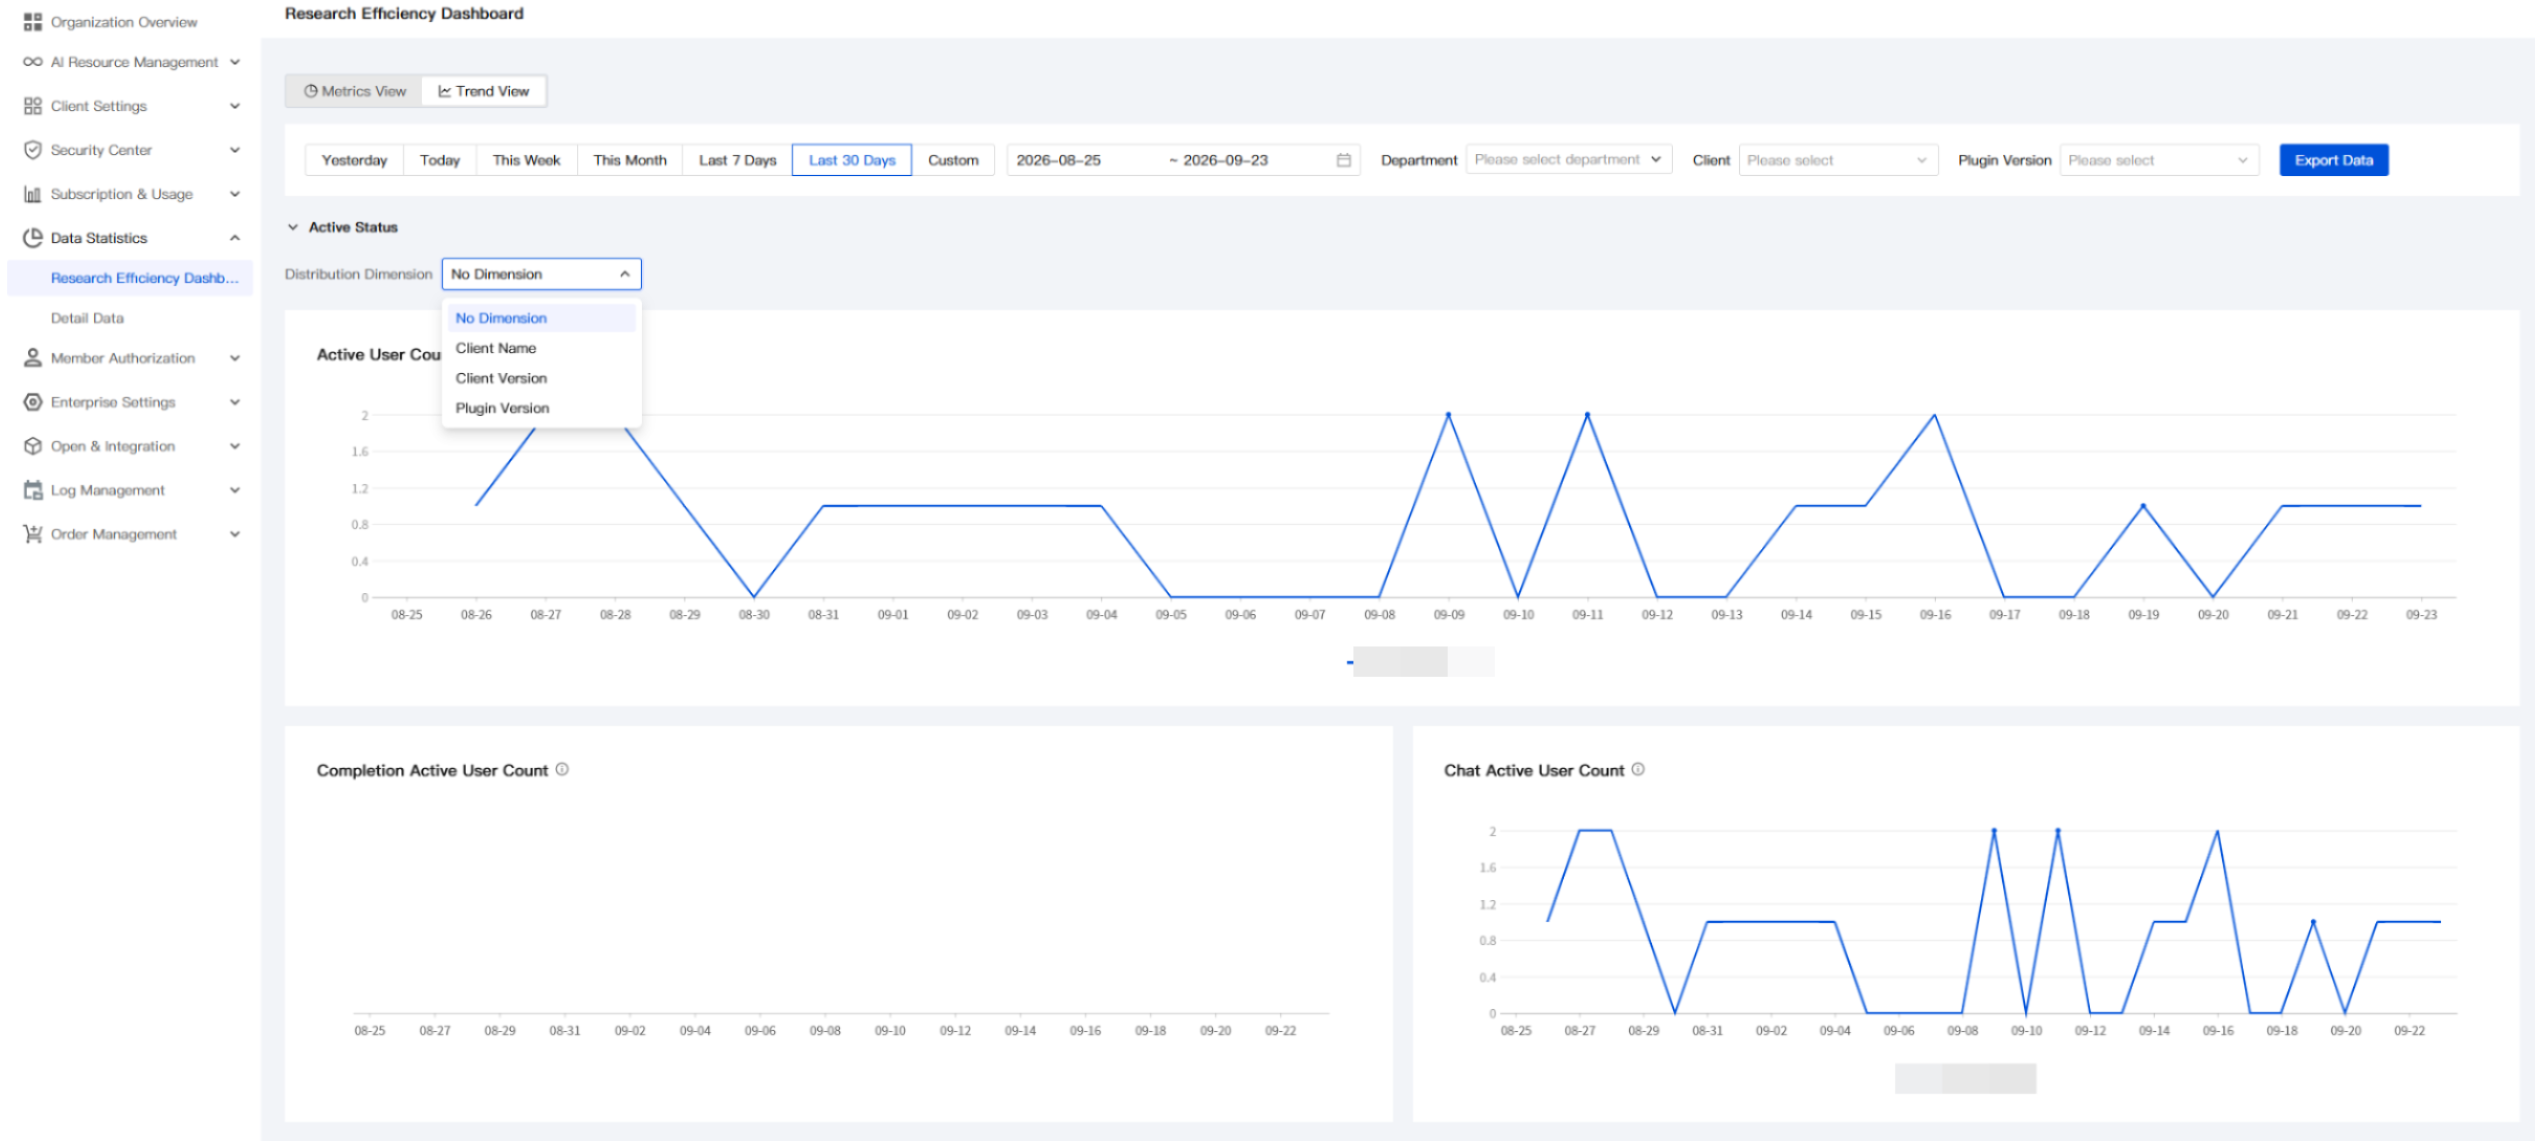
In the trend view, the metrics are essentially in one-to-one correspondence with those in the metrics view.
Activity
The Activity category includes three metrics: Active User Count, Completion Active User Count, and Chat Active User Count. Each metric can be clearly displayed by different IDEs. For example, you can view and analyze the trend lines of active users for each IDE in the current month.
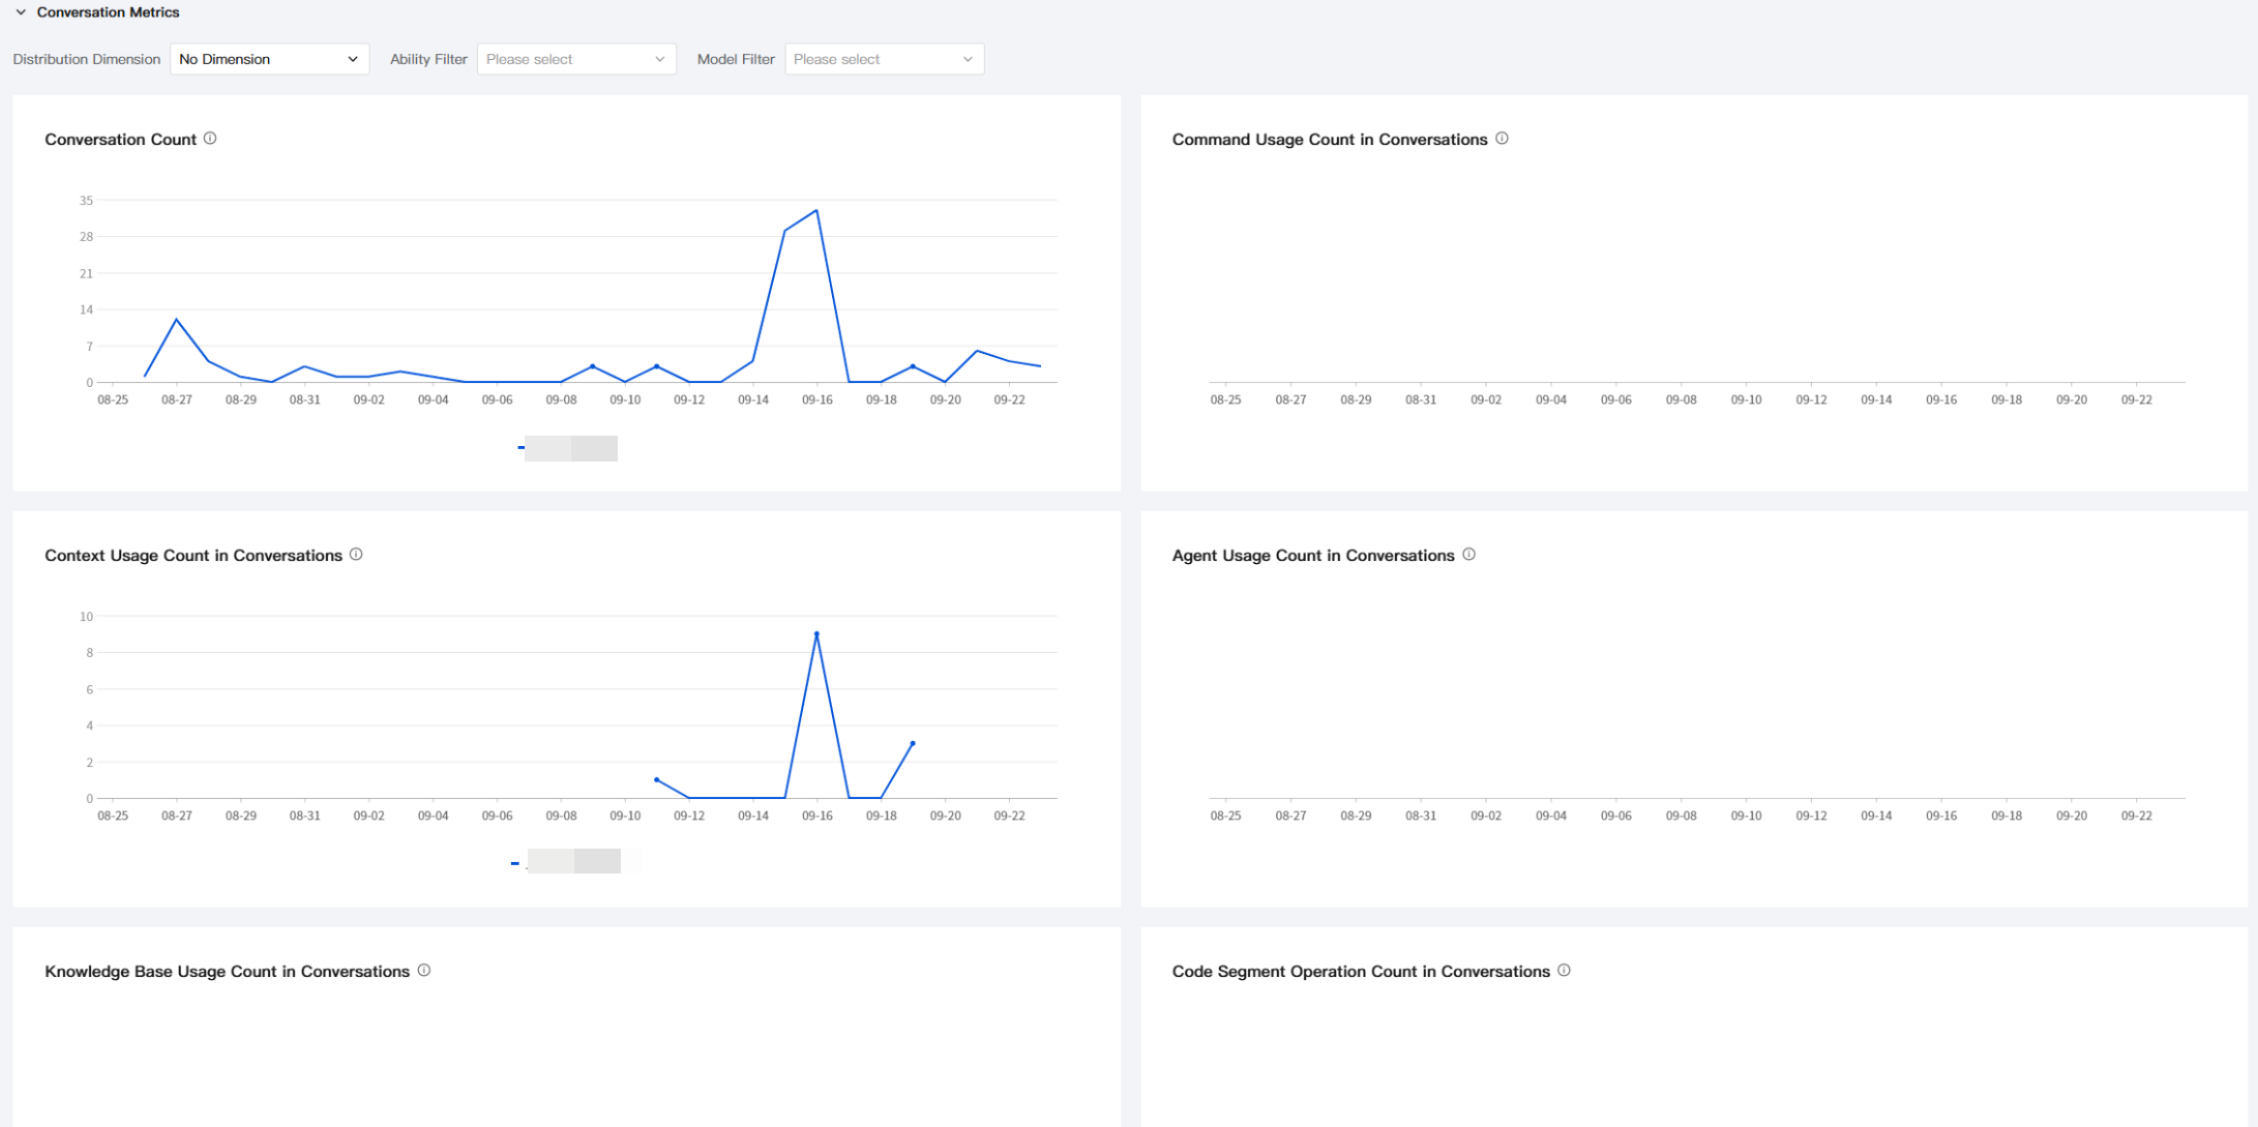
Conversation Metrics
The Conversation Metrics category includes six metrics: Conversation Count, Command Usage Count in Conversations, Context Usage Count in Conversations, Agent Usage Count in Conversations, Knowledge Base Usage Count in Conversations, and Code Segment Operation Count in Conversations. You can view the specific usage counts of these conversation metrics. For example, you can view and analyze the trend lines of each conversation metric for the current month.
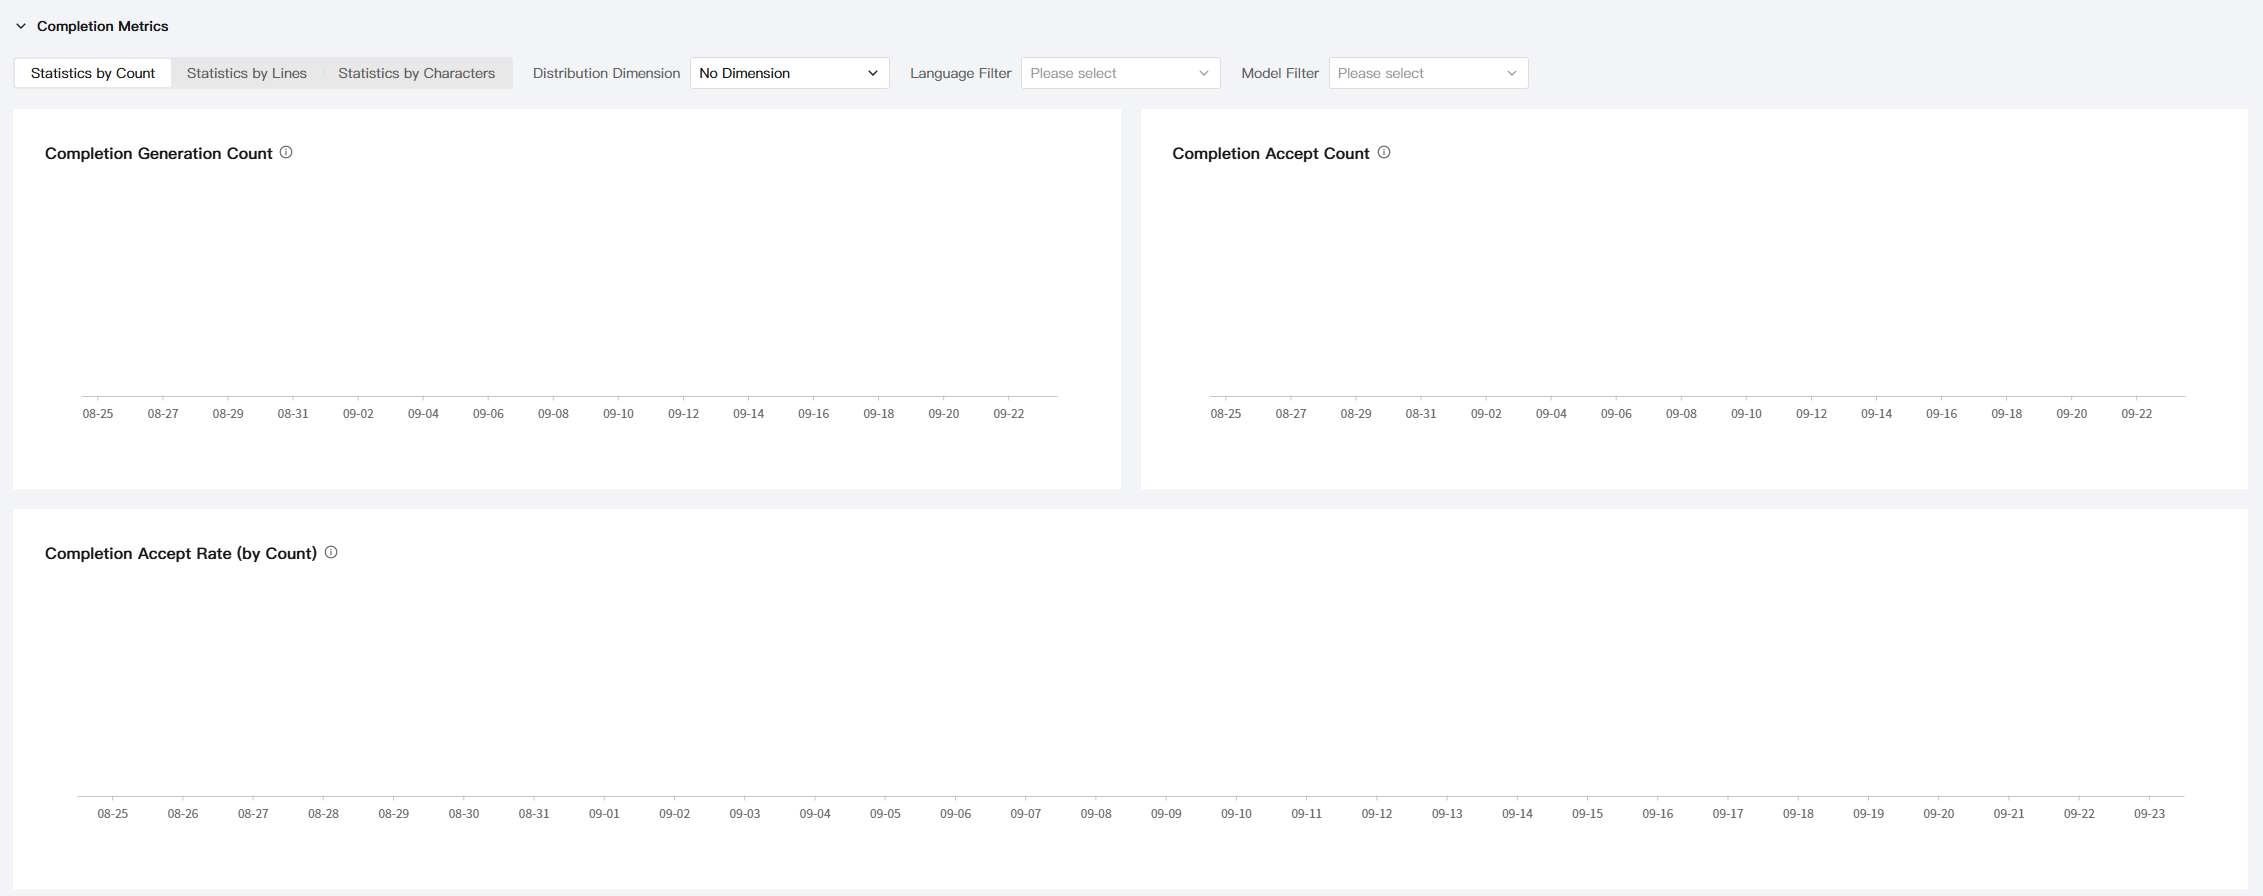
Completion Metrics
The Completion Metrics category is also divided into three statistical methods with different dimensions: Statistics by Count, Statistics by Lines, and Statistics by Characters. Each method contains corresponding metrics, and each metric can be clearly displayed by language. For example, you can view and analyze the trend lines of different languages under each metric.
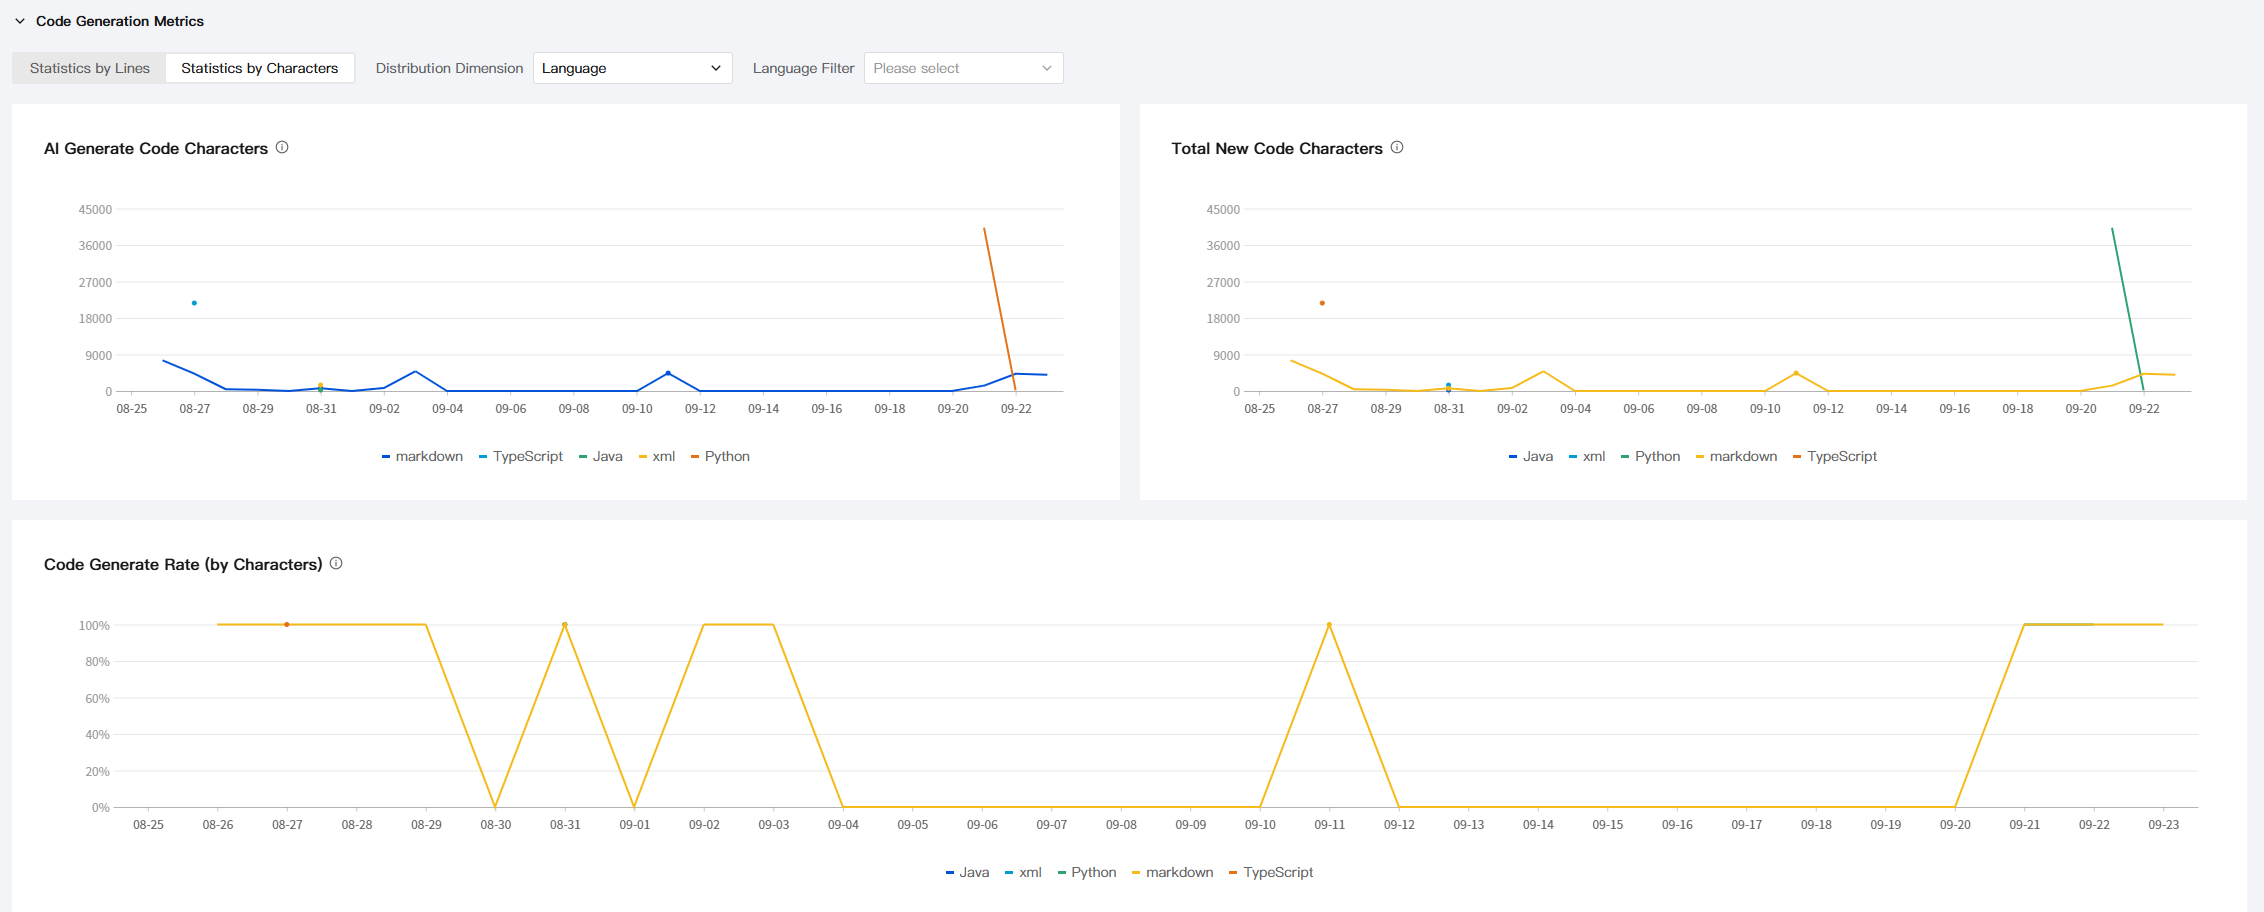
Code Generation Metrics
The Code Generation Metrics category is divided into two statistical methods with different dimensions: Statistics by Lines and Statistics by Characters. Each method contains corresponding metrics, and each metric can be displayed by language. For example, you can view and analyze the trend lines of different languages under each metric.
Metric Description
The following describes each metric:
Metric Name | Metric Meaning (Within Statistical Period) |
Number of active users | Number of users who have used completion or chat |
Active completion user quantity | Number of users who have used completion |
Active conversation user quantity | Number of users who have used chat |
Number of conversations | Total number of conversations |
Number of slash commands used in conversations | Number of slash commands used in conversations |
Number of context references in conversations | Number of context references via @ in conversations, including files, folders, and Diff files as added context types. Changes, knowledge bases, terminal commands, and other content |
Number of agent uses in conversations | Number of agents used in conversations, for example, "@workspace" |
Number of knowledge base uses in conversations | Number of knowledge base uses in conversations, for example, "#Vue" |
Number of operations on code snippets in conversations | Number of operations performed on code snippets returned in conversations |
Completion generation count/lines/characters | Total number of completions triggered by times/lines/characters |
Accepted completion count/lines/characters | Total accepted completion quantity/lines/characters |
Completion acceptance rate (by number of times) | Accepted completions/total completions |
Completion acceptance rate (by line) | Accepted completion lines/total completion lines |
Completion acceptance rate (by character) | Accepted completion characters/total completion characters |
Characters of AI-generated code | Code generated by AI through methods including code completion, Craft, Ask (operations such as code insertion), and Inline-Chat (inline conversations). |
Total characters of newly added code | Total newly added code, including code manually written by users and code generated by AI |
Code generation rate (by line) | AI-generated code lines/total newly added code lines |
Code generation rate (by character) | AI-generated code characters/total newly added code characters |
Note:
For total new lines or total new characters: includes manual user input and accepted completions. If the code is copied or imported, it must be limited to 5 lines. Code exceeding 5 lines is considered large-scale input and is not included in the statistics.
For newly added code (including code and comments generated by manual user input and accepted completions), additions are included in the statistics, while deletions are not. For example, if 10 lines of code are added and then deleted, the number of new lines remains 10.
For the number of completions: as long as a user triggers code completion, it is counted regardless of whether the user accepts or rejects the completion, and subsequent operations do not affect the number of completions. The same applies to completion lines and completion characters.
The difference between completion quantity/lines/characters and accepted completion quantity/lines/characters: the latter (accepted completions) is counted only after the user performs an acceptance action (such as pressing tab), while the former is counted regardless of whether an acceptance action is performed.
For comments: comments generated by completions, as well as their acceptance, are included in the metric statistics.
Statistical Time Dimension Filtering and Data Export
The dashboard supports filtering by statistical time dimension. In addition, it also supports exporting data for all metrics.

Help and Support
Was this page helpful?
You can also Contact sales or Submit a Ticket for help.
Help us improve! Rate your documentation experience in 5 mins.
Feedback