Cloud Native Gateway provides a health check mechanism. By configuring related policies, the gateway can perform liveness and readiness probes on service nodes. When a service node fails, the gateway can proxy requests to healthy nodes, enhancing the continuity of the gateway service.
Attention:
The health check mechanism of Cloud Native Gateway applies only to services of the IP list type. For K8S services, we recommend using the container health check mechanism.
Health Check Methods
Cloud Native Gateway provides two health check methods: active checks and passive checks.
active checks
Active checks indicate that the gateway actively detects the liveness of service nodes through the preset probe type. After the active health check is enabled, the gateway sends HTTP or HTTPS requests to the configured path of each service node based on the preset detection interval. Based on the detection results, the gateway automatically enables healthy nodes and disables unhealthy nodes.
passive checks
Passive checks are also called the circuit breaker mode. In this mode, the gateway checks the health status of backend nodes based on forwarded user requests (HTTP/HTTPS/TCP requests) and does not actively send detection requests. When a node does not respond, the gateway enables the passive health check, detects the node, and marks it as unhealthy.
Note:
In this mode, unhealthy nodes cannot receive requests. Even if a node recovers, the gateway cannot detect its recovery and mark it as healthy again. To mark the node as healthy, you need to call the management API provided by the gateway and inform the health checker to enable the node again. Therefore, it typically needs to be used together with the active health check policy.
How to Configure Health Checks
1. Log in to the TSF console, click Cloud Native Gateway > Instance Management in the left sidebar, and go to the instance list page.
2. Click the instance ID/Name to go to the instance details page.
3. Click Service Routing, select the Service tab, and then you can configure health check on the service list page or the service details page.
Configuring Active Health Checks
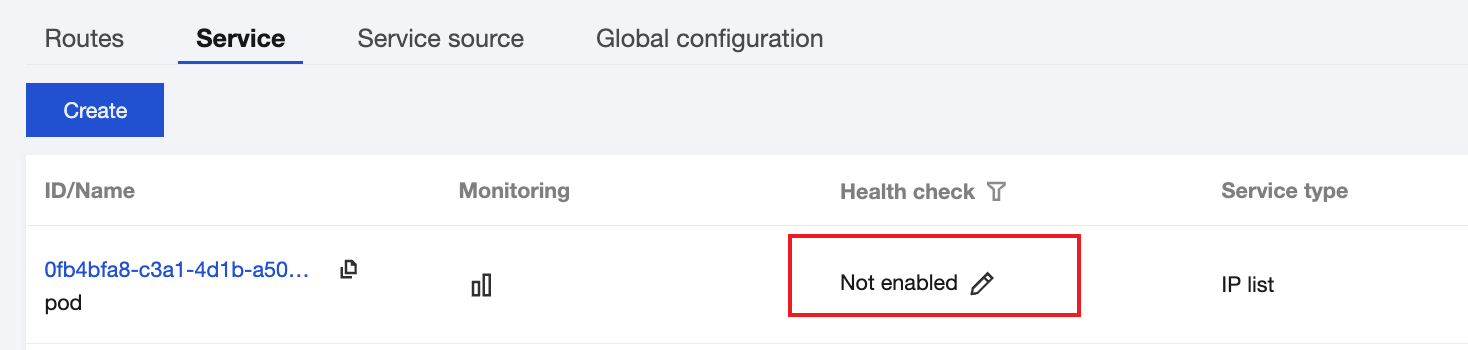
On the gateway service list page, click the edit icon in the Health Check column to configure health check.
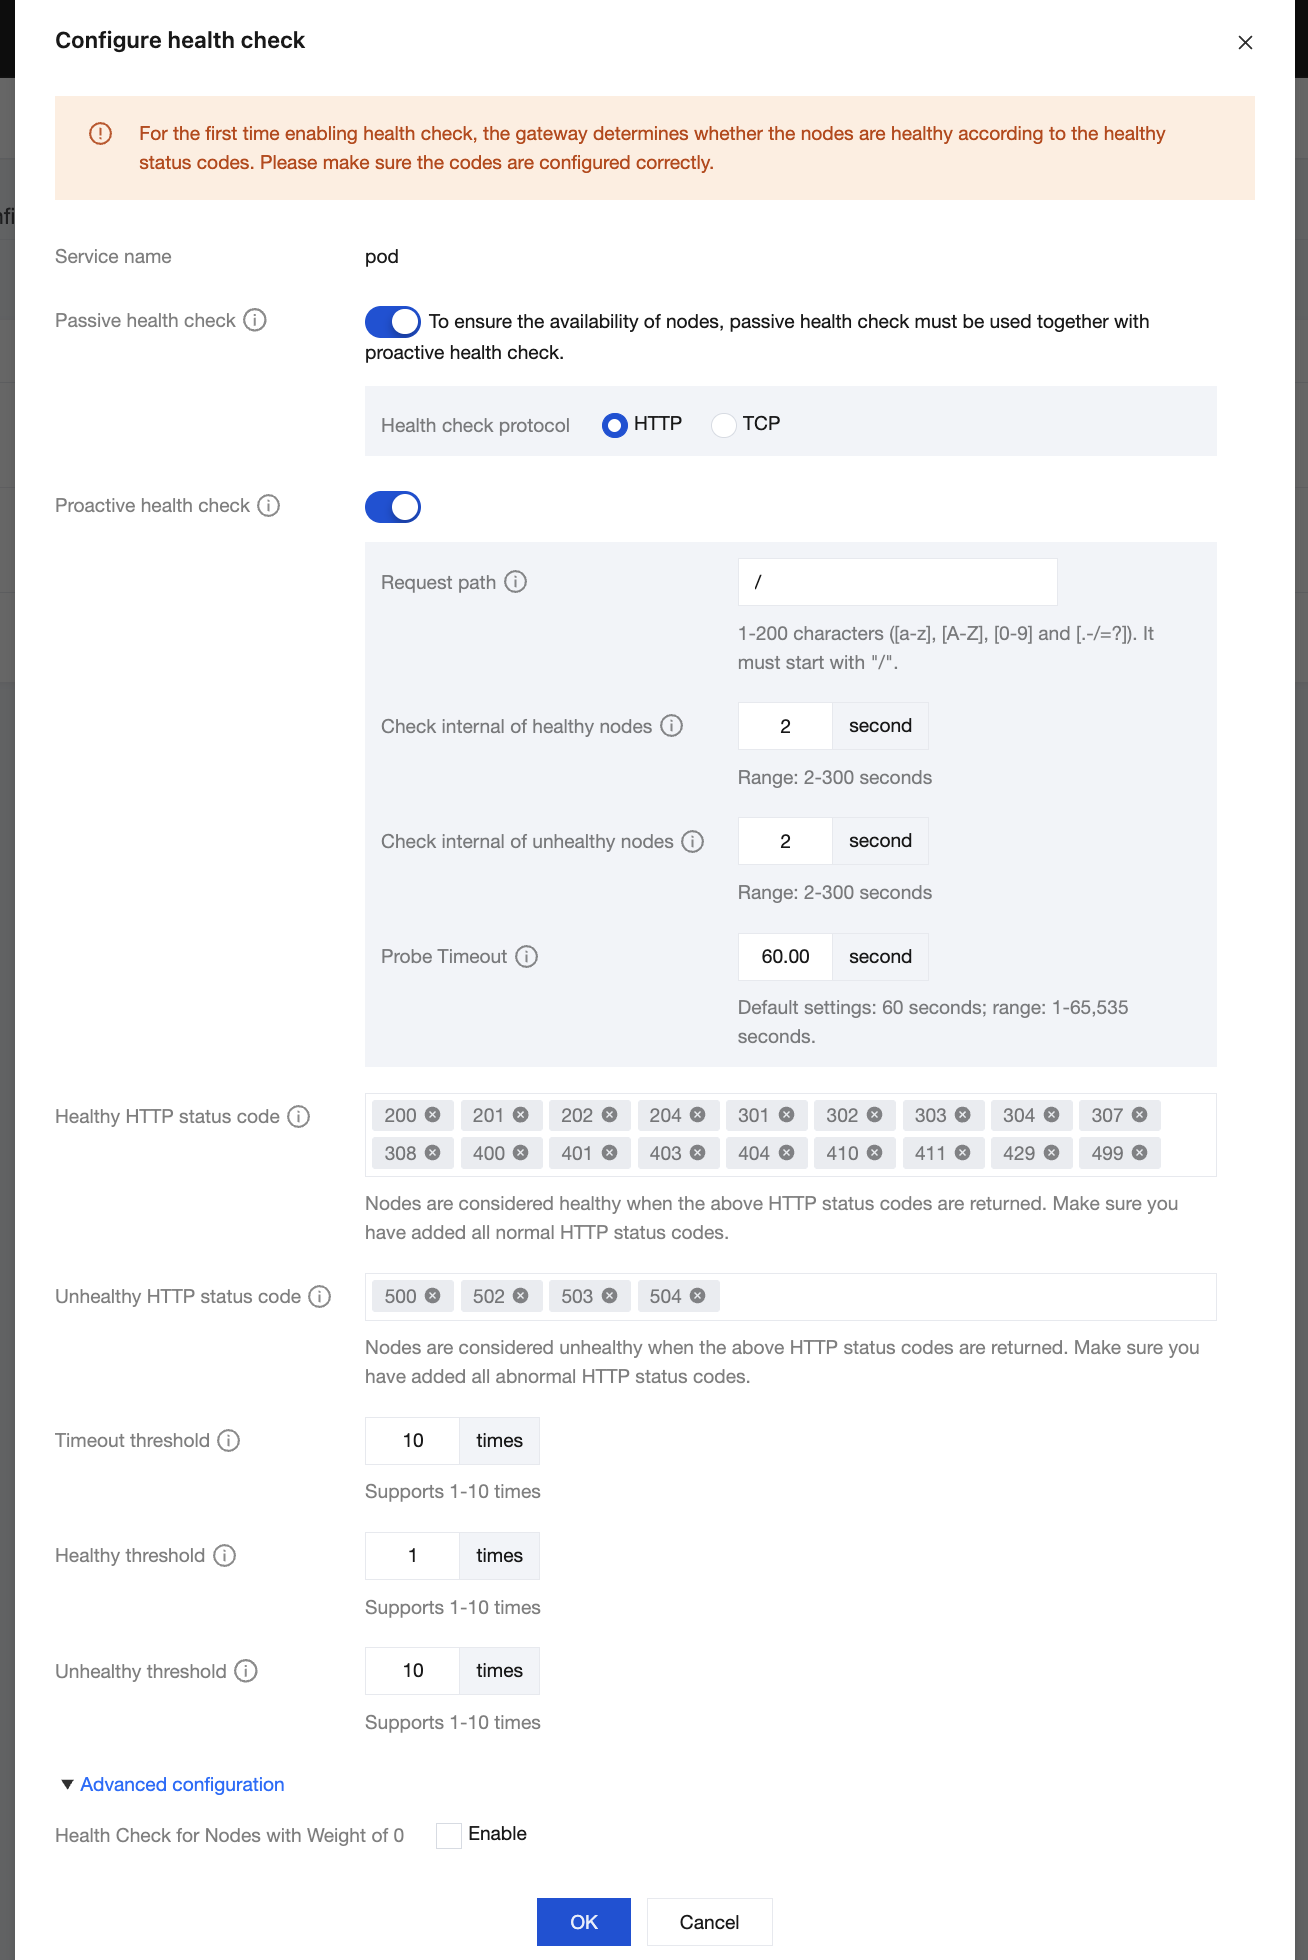
Passive Health Check: The health status of a node is determined based on the response status of the upstream node.
Active Health Check: The gateway actively detects the liveness of service nodes based on the preset detection interval.
Request Path: path used by the gateway to send active detection requests to the target node, which is "/" by default.
Health Check Interval: interval between two proactive health checks for a healthy node, ranging from 2 to 300 seconds.
Exception Check Interval: interval between two proactive health checks for an abnormal node, ranging from 2 to 300 seconds.
HTTP Status Code for Normal Health Checks: HTTP status code used to determine that a health check is normal. When the following HTTP status codes are returned, a node is marked as healthy. HTTP Status Code for Normal Health Checks is automatically specified to the following HTTP status codes.
2xx:200, 201,202,204
3xx:301, 302, 303, 304, 307,308
4xx:400, 401, 403, 404,410, 411,429, 499
HTTP Status Code for Exceptions: HTTP status code used to determine that a health check is abnormal. When the following HTTP status codes are returned, a node is marked as unhealthy. HTTP Status Code for Exceptions is automatically specified to the following HTTP status codes.
5xx:500,502,503,504
Timeout Threshold: number of consecutive health checks timed out. A node is marked as unhealthy when the number of consecutive health checks timed out exceeds the value. The default value is 10 times, and the value range is 1 to 10 times.
Consecutive Health Check Threshold: number of consecutive successful health checks. A node is marked as healthy when the number of consecutive successful health checks exceeds the value. The default value is 1 time, and the value range is 1 to 10 times.
Consecutive Exception Threshold: number of consecutive failed health checks. A node is marked as unhealthy when the number of consecutive failed health checks exceeds the value. The default value is 10 times, and the value range is 1 to 10 times.
Note:
When health check is enabled for the first time, the gateway marks the health statuses of nodes based on the value range of HTTP Status Code for Normal Health Checks. Ensure that the HTTP status code is configured correctly.
Monitoring the Health Check Status
After health check is configured, select Data Insights in the left sidebar, and choose Business Monitoring > Business Metrics at the top of the page.
Select a service to view the health statuses of nodes under the service.
Select an instance to view the health statuses of nodes under all services in the instance.
You can configure alarms for health check metrics.
Viewing the Node Status
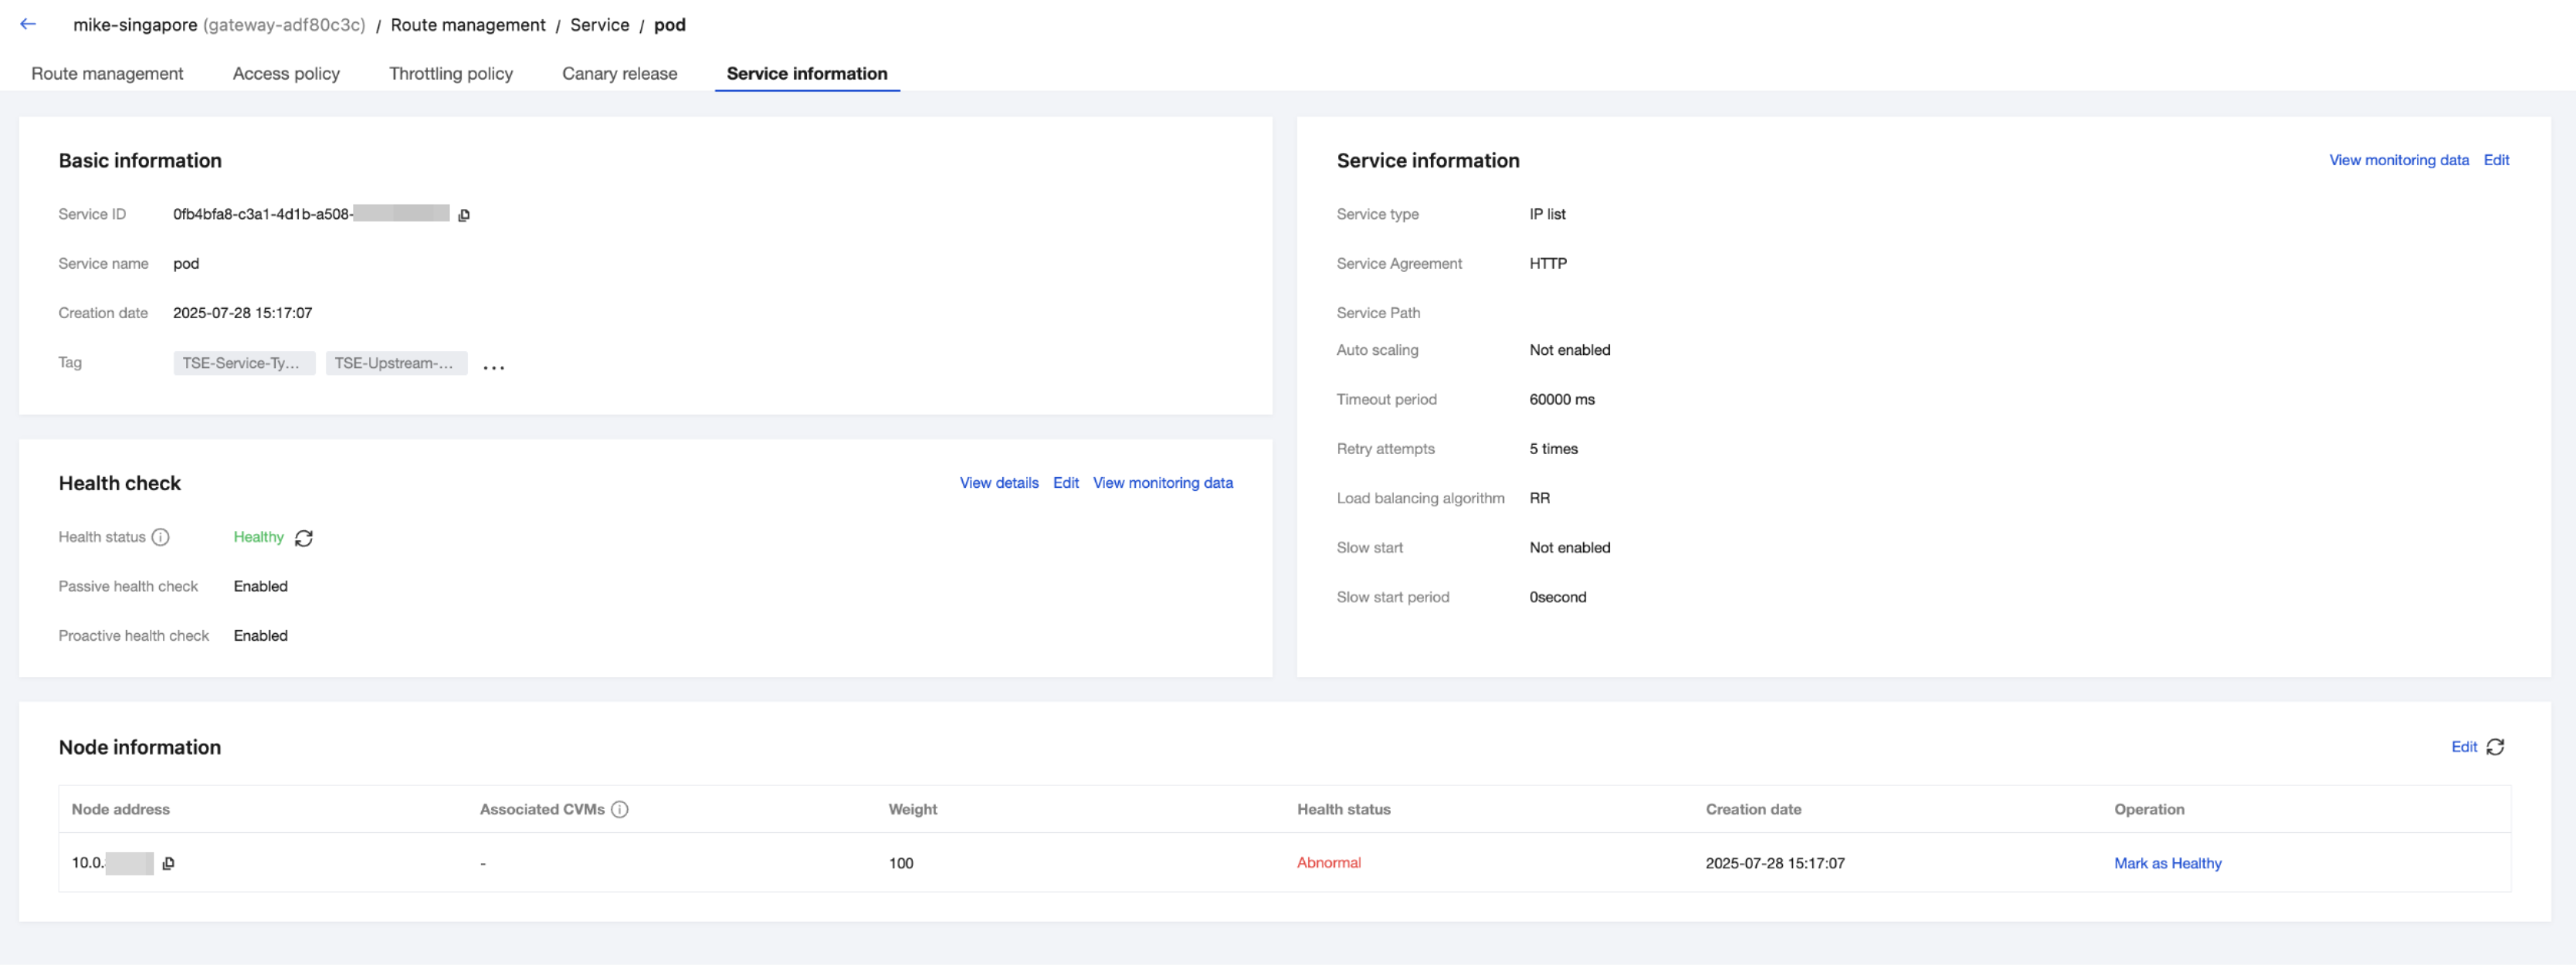
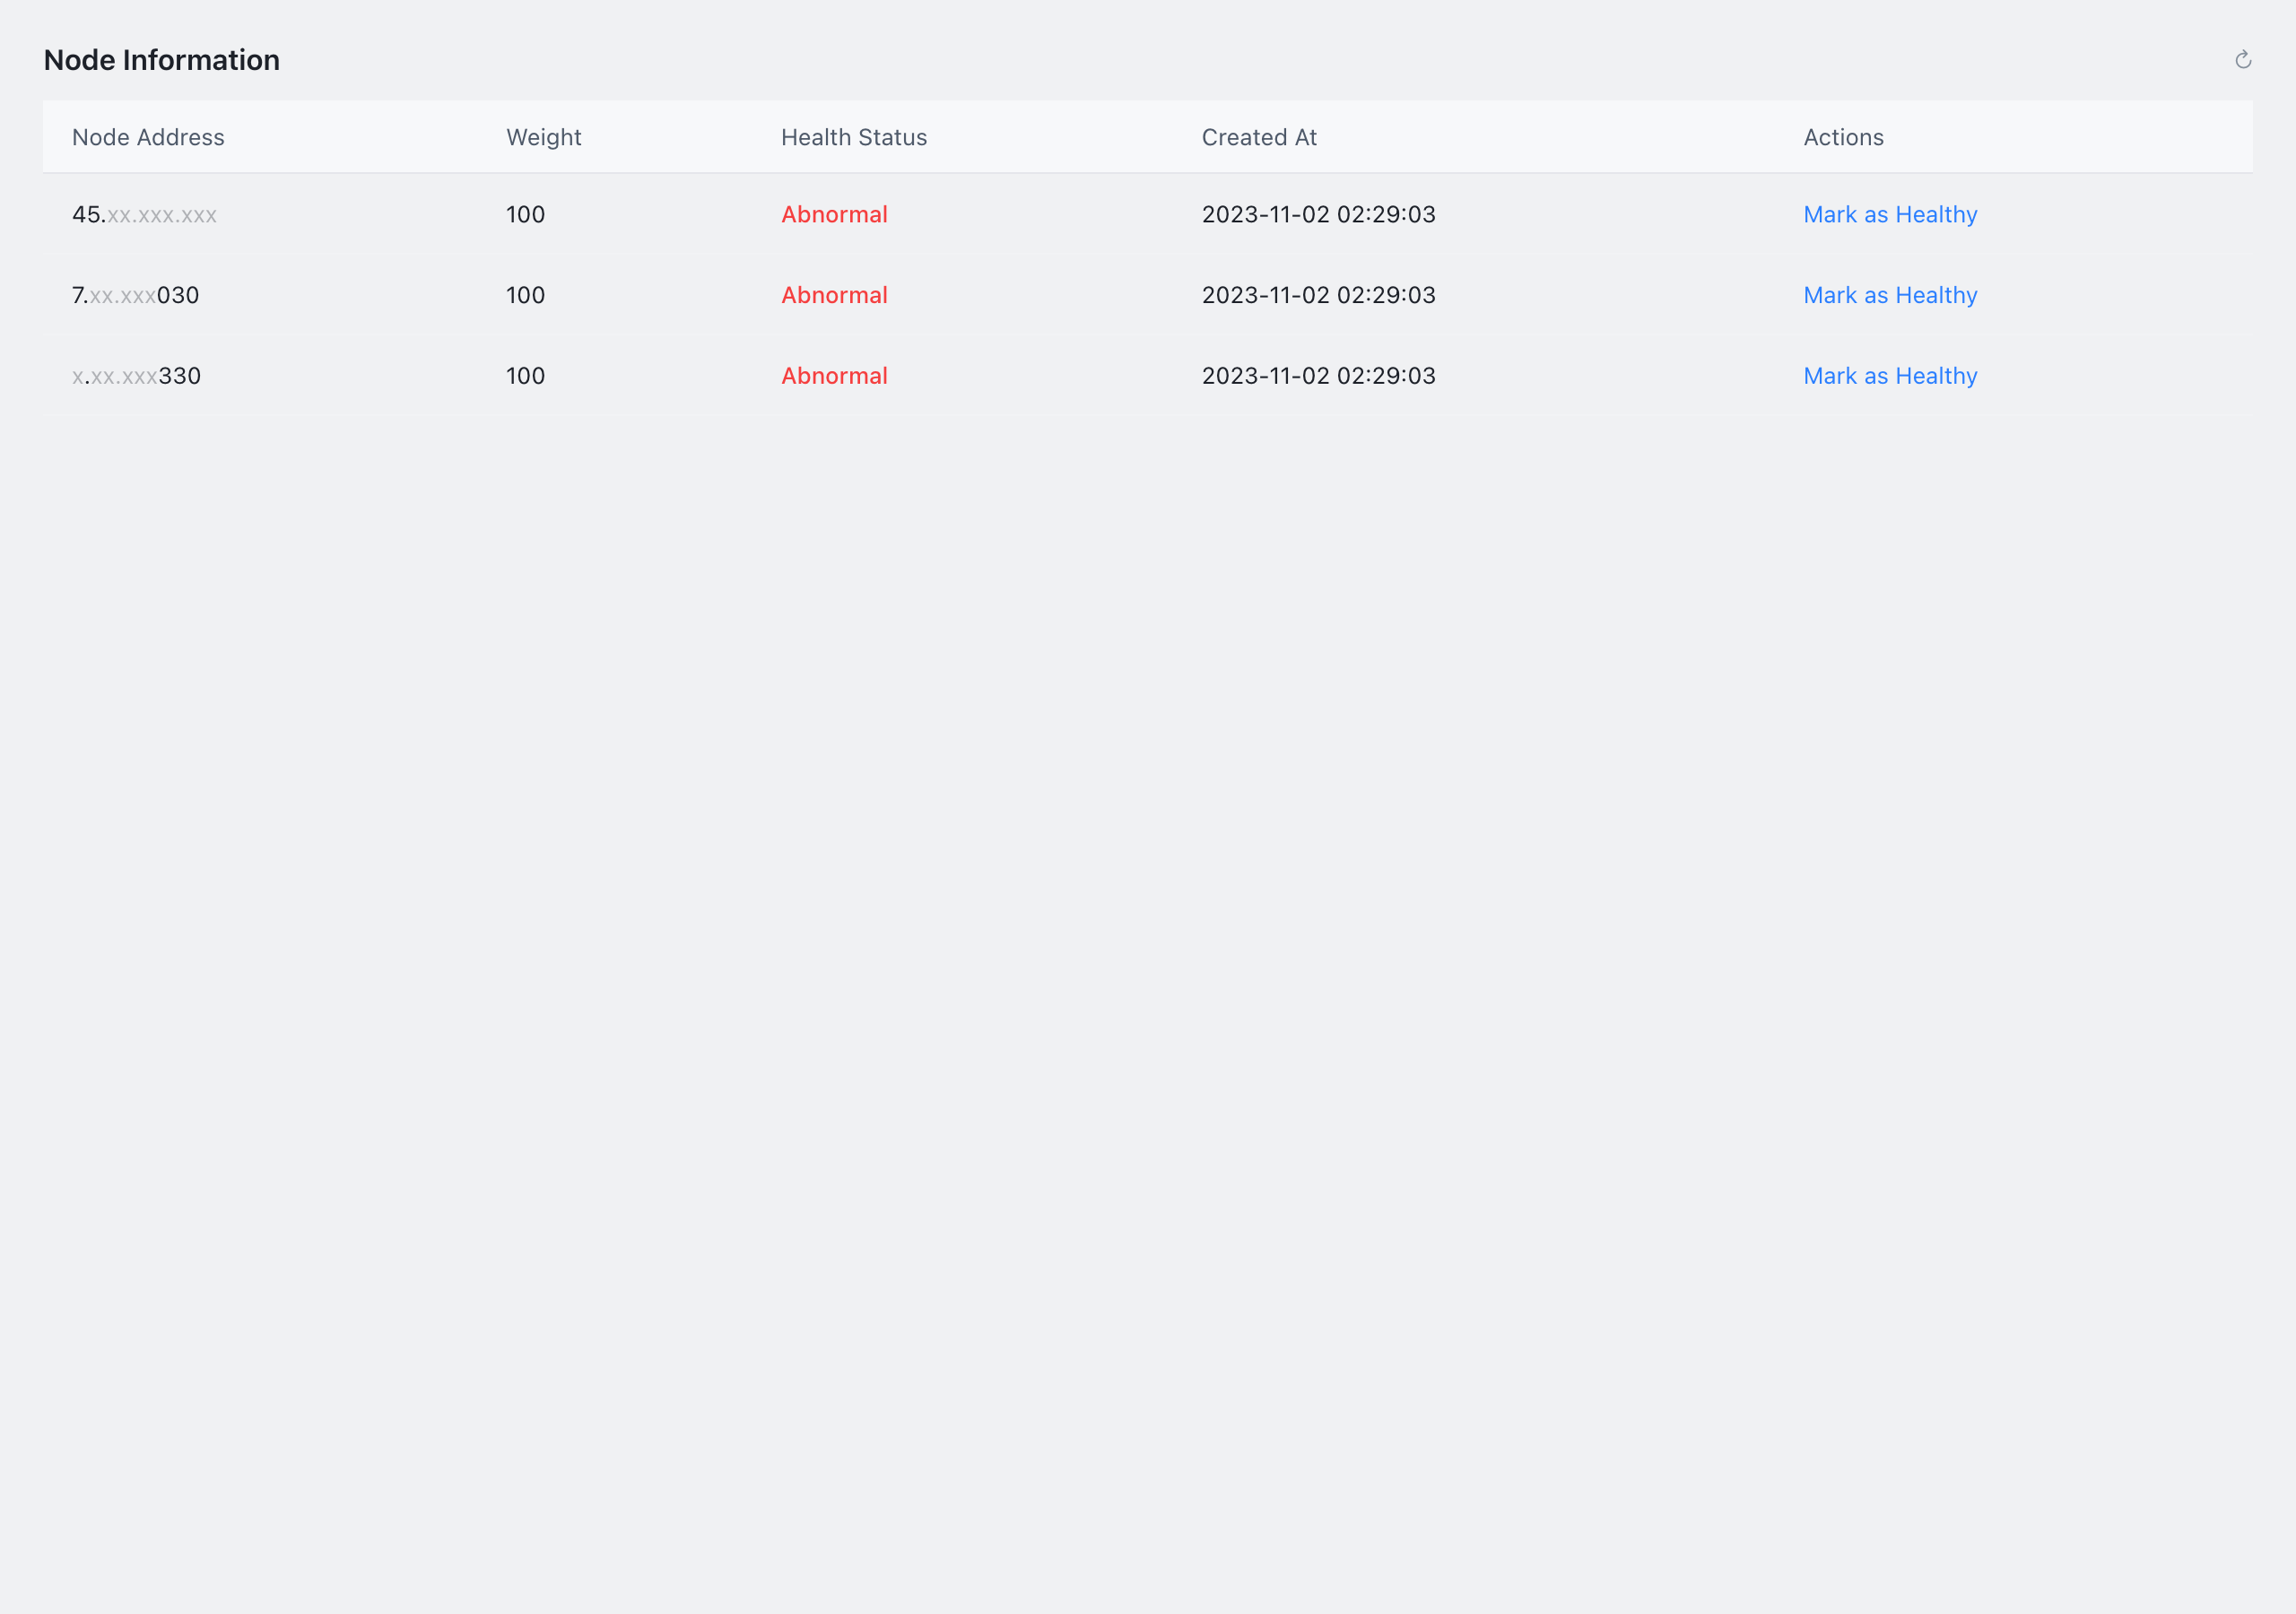
On the service details page, in the Service Information >Node Information module, you can view the health statuses of nodes under the service. You can manually modify the health status of a node in the Actions column of the node list.
Reasons Why a Service Does Not Support Health Checks
Domain name/IP type is not supported.
Reason: The node address is a domain name resolved by dynamic DNS. The gateway obtains a domain name, not a fixed list of IP addresses. Each request may be resolved to a different backend IP address. As a result, the target for health check's "liveness/deadness" probes cannot be stably directed to a specific node.
The registry (TSF PolarisMesh) type is not supported.
Reason: The registration center itself maintains node registration/deregistration and liveness through a heartbeat mechanism. PolarisMesh actively removes unhealthy instances. The gateway obtains a list of "healthy" nodes filtered by the registration center. Performing an additional layer of health check is redundant and may conflict with the judgment results of the registration center.